The Study of Spatial-Time-Frequency Correlation Properties of 5G Channel Modeling of MIMO-OFDM System
The fifth generation (5G) mobile communication systems will have the speed more 100 times compared to the
4G and with the aim is to provide every propagation environment for every destination. Multiple-input multipleoutput (MIMO) communication is the important technology researched for 5G systems. This paper studies the
correlation properties of 5G channel modeling in MIMO system such as auto-correlation functions of time and
frequency, as well as the spatial cross-correlation function. The scenarios UMi, RMa and indoor cells are
investigated at 6 GHz frequency band in non-line of sight (NLOS) case. We calculate the spatial-temporalfrequency correlation functions of the 5G MIMO channel to estimate the system level in physic layer. From
that, we conclude the minimum correlation values are depended on the distance of antenna elements in each
transmitter and receiver side. We also identify the offset in time and frequency domains to identify the stability
of the signal in a certain range.
Trang 1
Trang 2
Trang 3
Trang 4
Trang 5
Trang 6

Trang 7
Tóm tắt nội dung tài liệu: The Study of Spatial-Time-Frequency Correlation Properties of 5G Channel Modeling of MIMO-OFDM System
nith angle 𝜃 and the azimuth angle 𝜑. The multiple
BSs and MSs are used in Global Coordinate System
(GCS) and an array antenna for a BS/MS is used in
Local Coordinate System (LCS), which is used as a
reference to define the is pattern and polarization
vector far-field of each antenna element in an array.
The placement of an array within the GCS is
occurred when translating between the GCS and the
LCS by a sequence of rotations of the array with
respect to the GCS. Therefore, it is necessary to map
the vector fields of the array elements from the LCS to
the GCS on which depends only on the orientation of
the array. It leads that any arbitrary mechanical
orientation of the array can be achieved by rotating the
LCS with respect to the GCS.
We defined a GCS with coordinates
(𝑥, 𝑦, 𝑧, 𝜃 , 𝜙) and unit vectors ( �̂� , ϕ̂ ) and the LCS
with "primed" coordinates (𝑥’, 𝑦’, 𝑧’, 𝜃′, 𝜙′) and
"primed" unit vectors ( 𝜃′̂ , ϕ′̂ ). The arbitrary 3D-
rotation of the LCS with respect to the GCS given by
the angles 𝛼 , 𝛽 and 𝛾, called the bearing angle, the
down-tilt angle and the slant angle, respectively.
Fig. 1. The Cartesian of 5G channel modeling [3]
We set the �̇� axis is the original 𝑦 axis after the first
rotation about 𝑧, and the �̈� axis is the original 𝑥 axis
after the first rotation about 𝑧 and the second rotation
about �̇�.
A first rotation of α about 𝑧 sets the antenna bearing
angle. The second rotation of 𝛽 about �̇� sets the
antenna down-tilt angle. Finally, the third rotation of γ
about �̈� sets the antenna slant angle. The orientation of
the 𝑥, 𝑦, 𝑧 axes after all three rotations can be denoted
as 𝑥, 𝑦, 𝑧. The angular ѱ now in charge of rotation to
GCS is given as follow [3] and is illustrated in Fig. 2:
ѱ =
= arg (
𝑠𝑖𝑛γcosθsin(ϕ − α) +
+cosγ(cosβsinθ − sinβcosθcos(ϕ − α)))
+𝑗(𝑠𝑖𝑛γ cos(ϕ − α) + sinβcosγ sin(ϕ − α))
)
(1)
Fig. 2. Rotation of LCS w/ respect of GCS [3]
The simulators for 5G are defined and describe
for channel model calibration in Table 1 - Table 3 as
[3]:
- UMi (Street canyon, open area) with O2O and
O2I: the BSs are mounted below rooftop levels of
surrounding buildings. UMi open area is intended to
capture real-life scenarios in case of 50 to 100 m.
- Indoor: This scenario is intended to capture
various typical indoor deployment scenarios, including
office environments, and shopping malls. The BSs are
mounted at a height of 2-3 m either on the ceilings or
walls. The shopping malls are often 1-5 stories high
and several floors.
- RMa: The rural deployment scenario focuses on
larger and continuous coverage supporting high speed
 Journal of Science & Technology 144 (2020) 011-016
13
vehicle with noise-limited and/or interference limited,
using macro transmission reception points.
Table 1. Parameters for UMi-street canyon [3]
Parameters UMi -street canyon
Cell layout
Hexagonal grid, 19
micro sites, 3 sectors
per site ISD= 200m
BS antenna height ℎ𝐵𝑆 10m
UT
loca
-tion
Outdoor/indoor Outdoor and indoor
LOS/ NLOS LOS, NLOS
Height ℎ𝑈𝑇 3D-UMi, TR36.873
Indoor UT ratio 80%
UT mobility (horizon) 3km/h
Min. BS-UT distance 10m
UT distribution Uniform
Table 2. Parameters for indoor-office scenarios [3]
Parameters InH open
office
mixed
office
Layout
Room size 120𝑚 × 50𝑚 × 3𝑚
ISD 20m
BS antenna height ℎ𝐵𝑆 3 m (ceiling)
UT
location
LOS/NLOS LOS and NLOS
Height ℎ𝑈𝑇 1 m
UT mobility (horizon) 3 km/h
Min. BS - UT distance 0
UT distribution (horizon) Uniform
Table 3. Parameters for RMa [3]
Parameters RMa
Carrier Frequency Up to 7GHz
BS height ℎ𝐵𝑆 35m
Layout Hexagonal grid, 19 Macro
sites, 3sectors per site,
ISD = 1732m or 5000m
UT height ℎ𝑈𝑇 1.5m
UT distribution Uniform
Indoor/Outdoor 50% indoor and 50% in car
LOS/NLOS LOS and NLOS
Min distance 2D 35m
3. The properties of the correlation functions of the
5G channel modelling in case of NLOS
The specifications of NLOS 5G simulators define
the impulse respond function ℎ(, ) of 𝑠 BS antenna
elements and 𝑢 MS antenna elements [3].
ℎ𝑢,𝑠
𝑁𝐿𝑂𝑆(𝜏, 𝑡) = ∑∑ ∑ ℎ𝑢,𝑠,𝑛,𝑚
𝑁𝐿𝑂𝑆 (𝑡)𝛿(𝜏 − 𝜏𝑛,𝑖)
𝑚∈𝑅𝑖
3
𝑖=1
2
𝑛=1
+∑ℎ𝑢,𝑠,𝑛
𝑁𝐿𝑂𝑆(𝑡)𝛿(𝜏 − 𝜏𝑛)
𝑁
𝑛=3
(2)
The transfer function 𝐻(, ) in frequency domain
is the Fourier transform of ℎ(, ) the channel impulse
response and is calculated with 𝜏𝑛 is the delay of the
𝑛 cluster.
𝐻𝑢,𝑠(𝑓, 𝑡) = ∑ℎ𝑢,𝑠(𝜏, 𝑡) × 𝑒
−𝑗2𝜋𝜏𝑛𝑓
𝑁
𝑛=1
(3)
The spatial - temporal correlation function of
2 × 2 antenna system is calculated by the time average
operator as:
𝜌(Δ𝑑𝑠, Δ𝑑𝑢 , Δ𝑡 , Δ𝑓 = 0) =
〈𝐻𝑢1,𝑠1(𝑓, 𝑡) × 𝐻𝑢2,𝑠2
∗ (𝑓, 𝑡 + Δ𝑡)〉 =
= ∑√
𝑃𝑛
𝑀
∑
(
×
𝑒
𝑗2𝜋(�̂�𝑟𝑥,𝑛,𝑚
𝑇 ×Δ�̅�𝑟𝑥,𝑢)
𝜆0
×
𝑒
𝑗2𝜋(�̂�𝑟𝑥,𝑛,𝑚
𝑇 ×Δ�̅�𝑡𝑥,𝑠)
𝜆0
𝑒
𝑗2𝜋(�̂�𝑟𝑥,𝑛,𝑚
𝑇 ×�̅�)
𝜆0
Δ𝑡
)
𝑀
𝑚=1
𝑁
𝑛=1
(4)
The correlation function can be done by using the
average time of the two transfer functions. The channel
correlation of is represented by the cross-correlation
function in case of NLOS scenarios. The spatial-
temporal- frequency correlation functions of the
transmitter and receiver MIMO 2 × 2 are calculated
by the time average operation as in equation (5). The
𝐹𝑟𝑥,𝑢,𝜃 , 𝐹𝑟𝑥,𝑢,𝜙 are the radiation field of the receive
antenna element 𝑢 with direction �̂�, �̂�; 𝐹𝑡𝑥,𝑠,𝜃 , 𝐹𝑡𝑥,𝑠,𝜙 is
the radiation field of transmit antenna element 𝑠 with
direction �̂�, �̂�; �̂�𝑟𝑥,𝑛,𝑚
𝑇 is the spherical unit vector as the
angle 𝜙𝑛,𝑚,𝐴𝑂𝐴 and 𝜃𝑛,𝑚,𝑍𝑂𝐴; �̂�𝑡𝑥,𝑛,𝑚
𝑇 is the spherical
unit vector as the angle 𝜙𝑛,𝑚,𝐴𝑂𝐷 and 𝜃𝑛,𝑚,𝑍𝑂𝐷; �̅�𝑟𝑥,𝑢,
�̅�𝑡𝑥,𝑠 is the location vector of antenna element u, s.
Set Δ𝑑𝑠 = 0, Δ𝑑𝑢 = 0, the auto correlation
(Temporal Correlation Function – TCF) is calculated
as:
𝜌(Δ𝑡) = ∑√
𝑃𝑛
𝑀
∑ exp (
𝑗2𝜋(�̂�𝑟𝑥,𝑛,𝑚
𝑇 × �̅�)
𝜆0
Δ𝑡)
𝑀
𝑚=1
𝑁
𝑛=1
(5)
Set Δ𝑑𝑠 = 0, Δ𝑑𝑢 = 0 and Δ𝑡 = 0, the auto
correlation (Frequency Correlation Function–FCF) is
shown as:
𝜌(Δ𝑓) = ∑√
𝑃𝑛
𝑀
𝑁
𝑛=1
exp (−𝑗2𝜋𝜏𝑛Δ𝑓) (6)
Set Δ𝑡 = Δ𝑓 = 0 and Δ𝑑𝑢 = 0, the cross spatial
correlation function of the channel at the transmitter is
presented as:
𝜌(Δ𝑑𝑠) = ∑√
𝑃𝑛
𝑀
∑ 𝑒
𝑗2𝜋(�̂�𝑡𝑥,𝑛,𝑚
𝑇 ×Δ�̅�𝑡𝑥,𝑠)
𝜆0
𝑀
𝑚=1
𝑁
𝑛=1
 (7)
Similarity, the cross spatial correlation function
at the receiver when Δ𝑡 = Δ𝑓 = 0 and Δ𝑑𝑠 = 0 is as
follow:
 Journal of Science & Technology 144 (2020) 011-016
14
Fig. 3. The transfer function of UMi
Fig. 5. The transfer function of InH scenario
Fig. 4. The transfer function of RMa
Fig. 6. The correlation properties in BS side
𝜌(Δ𝑑𝑢) = ∑√
𝑃𝑛
𝑀
∑ 𝑒
𝑗2𝜋(�̂�𝑟𝑥,𝑛,𝑚
𝑇 ×Δ�̅�𝑟𝑥,𝑢 )
𝜆0
𝑀
𝑚=1
𝑁
𝑛=1
(8)
4. The simulation of correlation properties of 5G
channel modeling
The graph of the channel’s transfer function is
obeyed the Rayleigh distribution. The transfer function
is a probability procedure which depends on the
frequency and time in NLOS case.
The shape of the element 𝐻11 of the channel in
UMi environment in Fig. 3 has the Rayleigh
distribution, with the maximum point is .0058 at the
eighth carrier-wave.
Fig. 4 and Fig. 5 are the graphs of the transfer
function of the RMa and the InH in the case of NLOS.
The amplitude in the RMa is smaller than the InH with
the maximum point is .0039 at the fifth carrier-wave.
The InH has the lowest path loss, the maximum point
is .003 at the 61th carrier-wave.
The graphs of the spatial CCF built from the
transfer function is present for 3 environments in case
of NLOS in Fig. 6. The spatial correlation’s graph is at
the transmitter BS’s side when set Δ𝑑𝑢 = 0. Those are
having similar shape with different correlation values.
The minimum amplitudes in three scenarios are in the
range of the number of from 1600 to 1800 carrier-
wave.
The minimum correlation value (MCV) have had
by substituting the Δ𝑑𝑢 , Δ𝑑𝑠 into equation (5) with
Δ𝑡 = Δ𝑓 = 0 and is given in Table 4. At each
environment, each of the MCV is regard to the
obtained the distance of the antenna elements in BS
side.
Table 4. The min correlation value in BS side
UMi
MCV 0.128 0.148 0.104
𝚫𝒅𝒔 0.006 0.022 0.036
RMa
MCV 0.071 0.059
𝚫𝒅𝒔 0.011 0.032
In-
door
MCV 0.061 0.072 0.062 0.056
𝚫𝒅𝒔 0.006 0.017 0.027 0.038
 Journal of Science & Technology 144 (2020) 011-016
15
Table 5. The min correlation value in MS side
UMi MCV 0.051 0.085
𝚫𝒅𝒔 0.011 0.029
RMa MCV 0.013 0.064
𝚫𝒅𝒔 0.009 0.028
Indoor MCV 0.109 0.083 0.017 0.09
𝚫𝒅𝒔 0.006 0.018 0.028 0.039
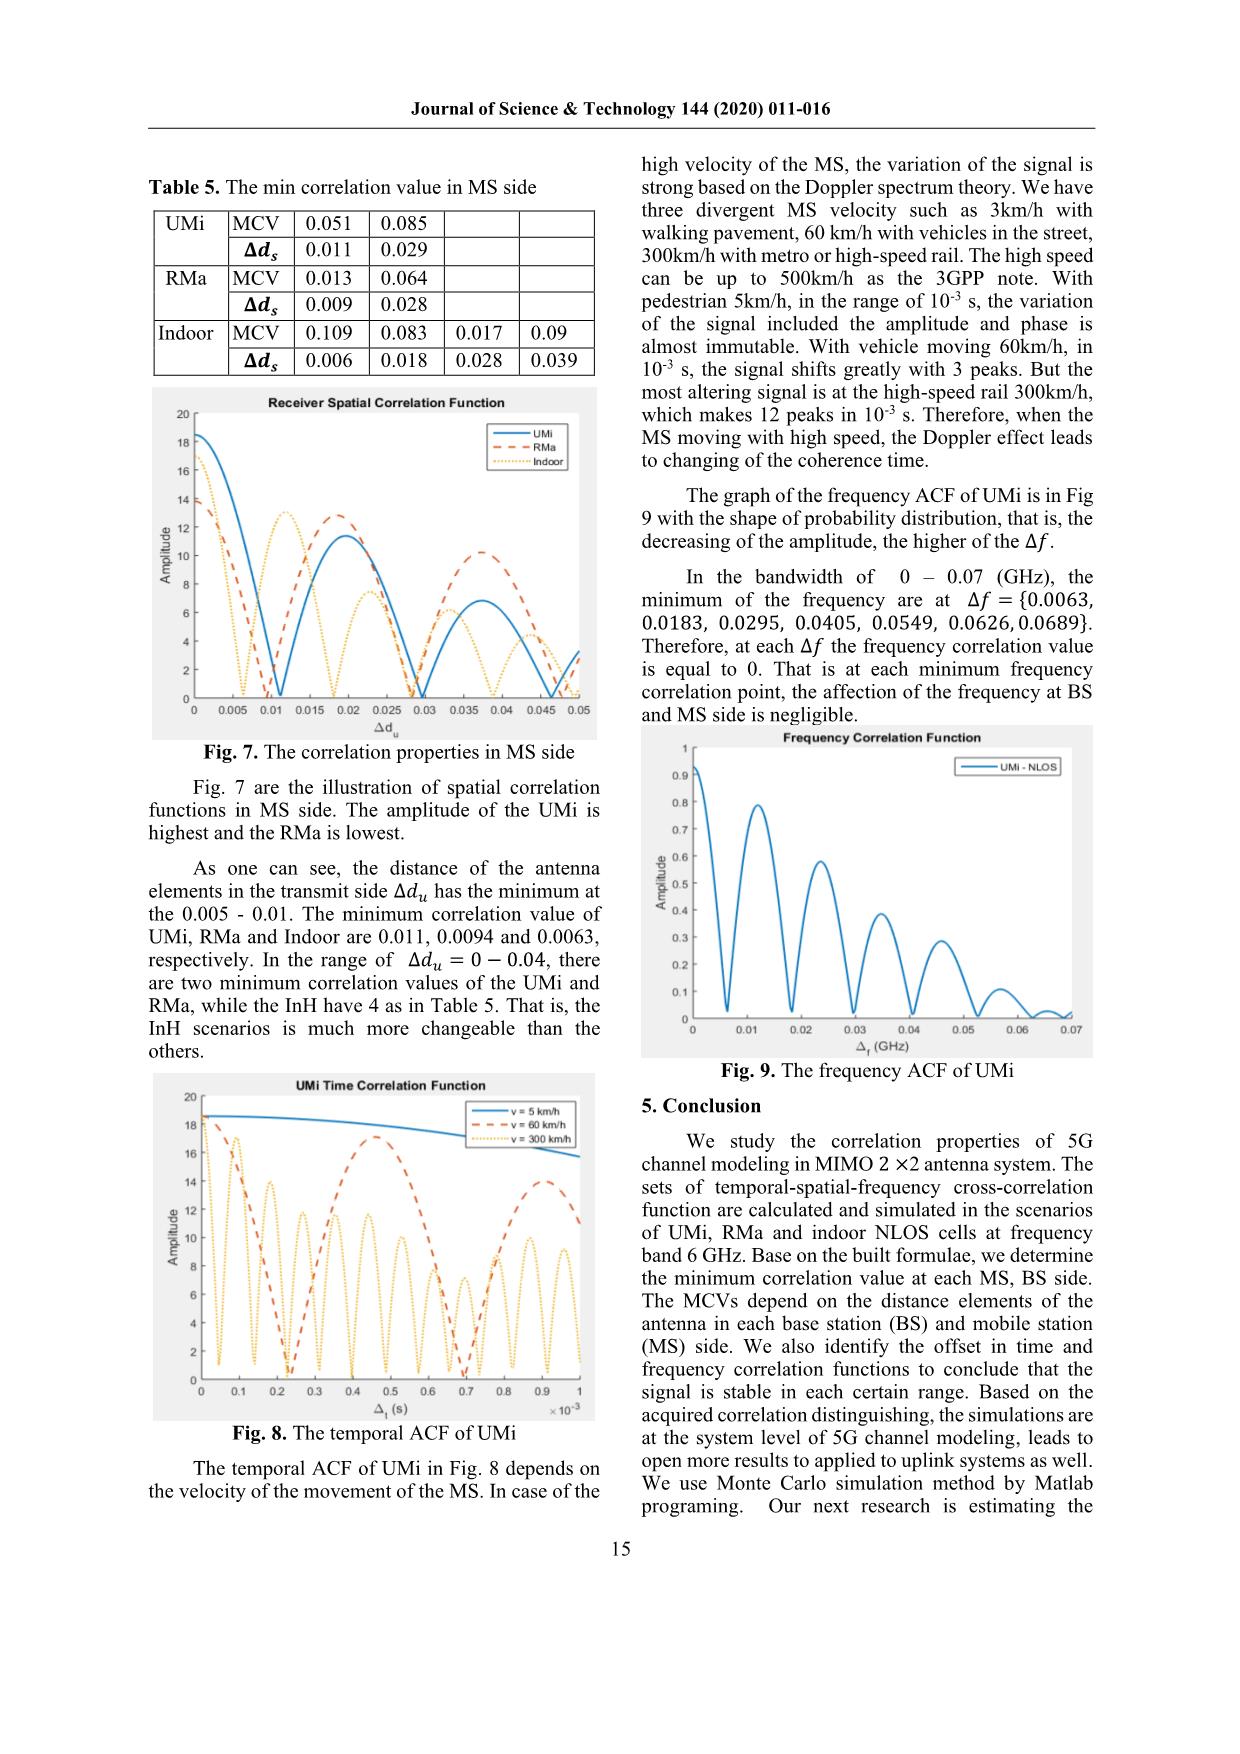
Fig. 7. The correlation properties in MS side
Fig. 7 are the illustration of spatial correlation
functions in MS side. The amplitude of the UMi is
highest and the RMa is lowest.
As one can see, the distance of the antenna
elements in the transmit side Δ𝑑𝑢 has the minimum at
the 0.005 - 0.01. The minimum correlation value of
UMi, RMa and Indoor are 0.011, 0.0094 and 0.0063,
respectively. In the range of Δ𝑑𝑢 = 0 − 0.04, there
are two minimum correlation values of the UMi and
RMa, while the InH have 4 as in Table 5. That is, the
InH scenarios is much more changeable than the
others.
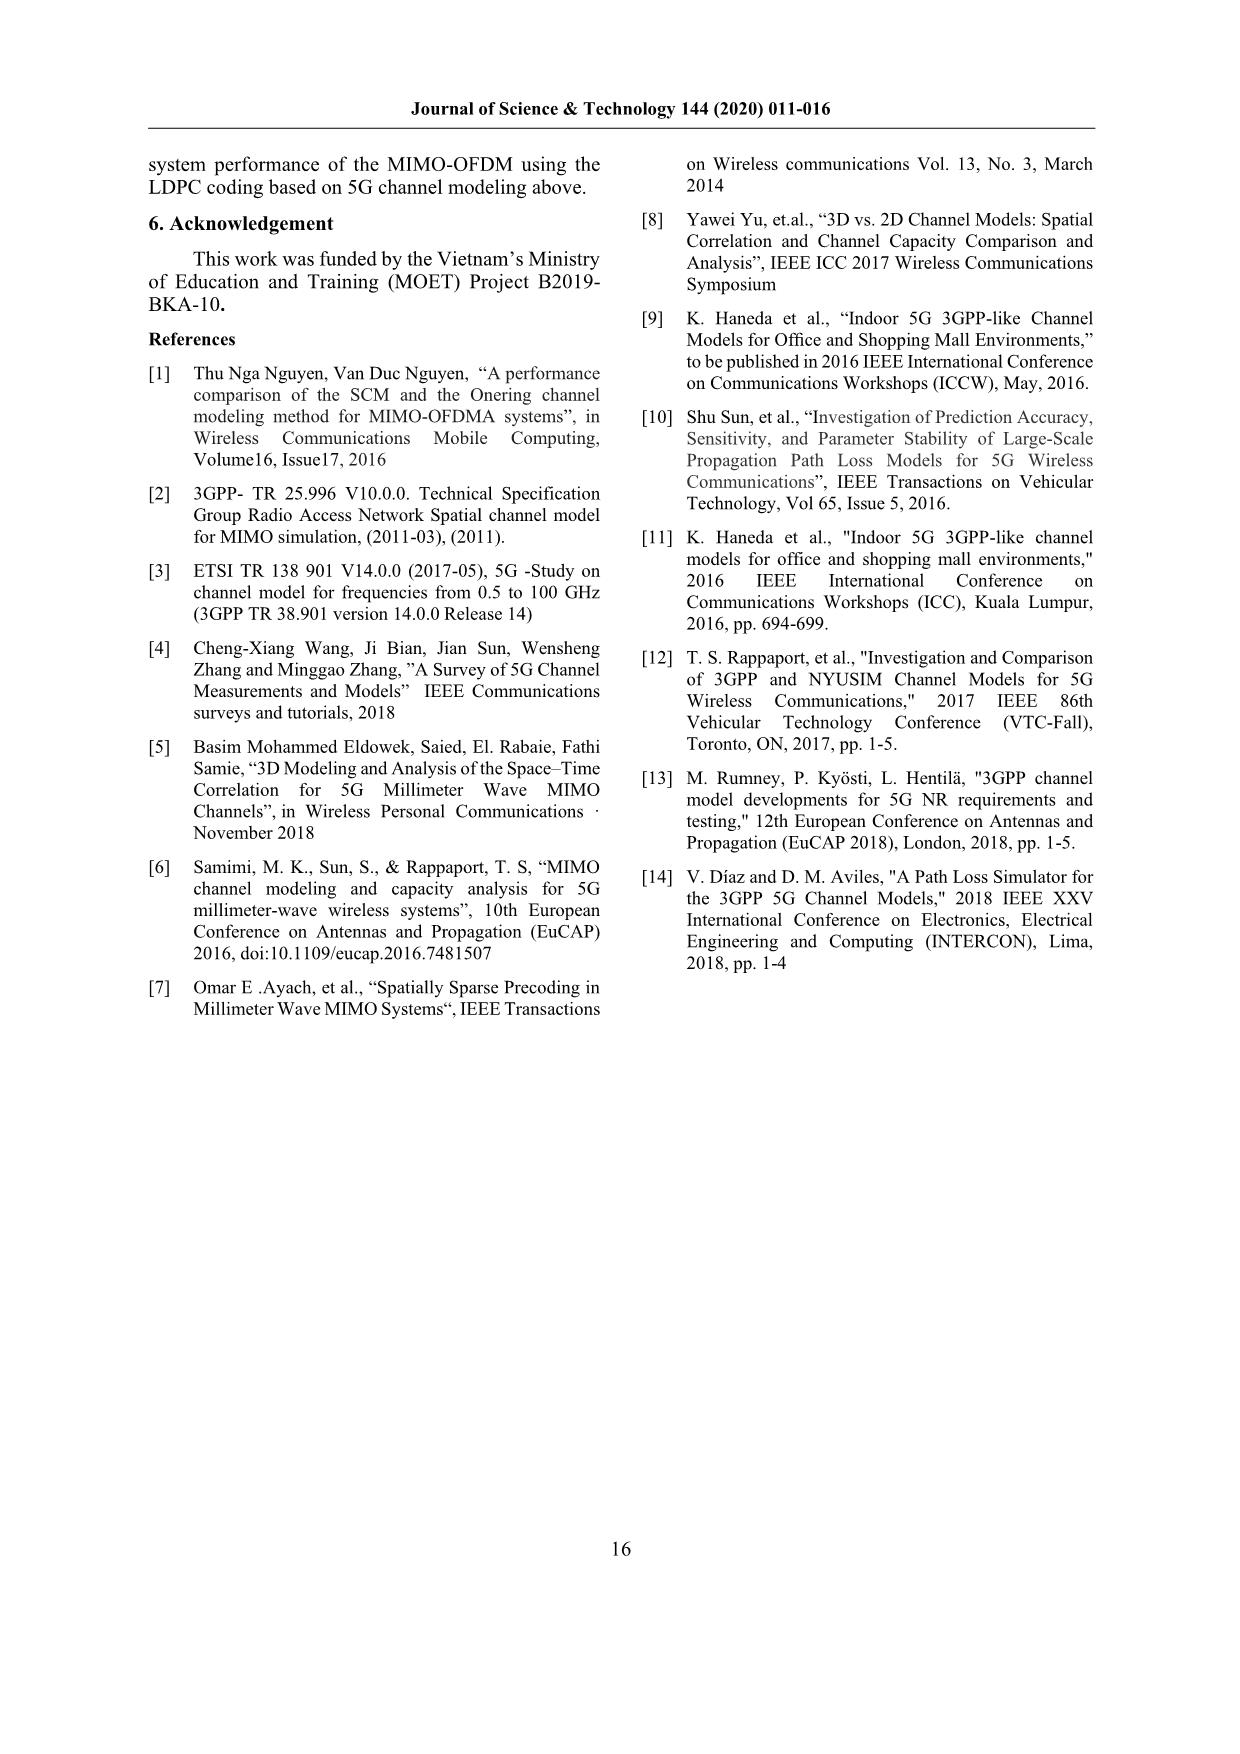
Fig. 8. The temporal ACF of UMi
The temporal ACF of UMi in Fig. 8 depends on
the velocity of the movement of the MS. In case of the
high velocity of the MS, the variation of the signal is
strong based on the Doppler spectrum theory. We have
three divergent MS velocity such as 3km/h with
walking pavement, 60 km/h with vehicles in the street,
300km/h with metro or high-speed rail. The high speed
can be up to 500km/h as the 3GPP note. With
pedestrian 5km/h, in the range of 10-3 s, the variation
of the signal included the amplitude and phase is
almost immutable. With vehicle moving 60km/h, in
10-3 s, the signal shifts greatly with 3 peaks. But the
most altering signal is at the high-speed rail 300km/h,
which makes 12 peaks in 10-3 s. Therefore, when the
MS moving with high speed, the Doppler effect leads
to changing of the coherence time.
The graph of the frequency ACF of UMi is in Fig
9 with the shape of probability distribution, that is, the
decreasing of the amplitude, the higher of the Δ𝑓.
In the bandwidth of 0 – 0.07 (GHz), the
minimum of the frequency are at Δ𝑓 = {0.0063,
0.0183, 0.0295, 0.0405, 0.0549, 0.0626, 0.0689}.
Therefore, at each Δ𝑓 the frequency correlation value
is equal to 0. That is at each minimum frequency
correlation point, the affection of the frequency at BS
and MS side is negligible.
Fig. 9. The frequency ACF of UMi
5. Conclusion
We study the correlation properties of 5G
channel modeling in MIMO 2 ×2 antenna system. The
sets of temporal-spatial-frequency cross-correlation
function are calculated and simulated in the scenarios
of UMi, RMa and indoor NLOS cells at frequency
band 6 GHz. Base on the built formulae, we determine
the minimum correlation value at each MS, BS side.
The MCVs depend on the distance elements of the
antenna in each base station (BS) and mobile station
(MS) side. We also identify the offset in time and
frequency correlation functions to conclude that the
signal is stable in each certain range. Based on the
acquired correlation distinguishing, the simulations are
at the system level of 5G channel modeling, leads to
open more results to applied to uplink systems as well.
We use Monte Carlo simulation method by Matlab
programing. Our next research is estimating the
 Journal of Science & Technology 144 (2020) 011-016
16
system performance of the MIMO-OFDM using the
LDPC coding based on 5G channel modeling above.
6. Acknowledgement
This work was funded by the Vietnam’s Ministry
of Education and Training (MOET) Project B2019-
BKA-10.
References
[1] Thu Nga Nguyen, Van Duc Nguyen, “A performance
comparison of the SCM and the Onering channel
modeling method for MIMO‐OFDMA systems”, in
Wireless Communications Mobile Computing,
Volume16, Issue17, 2016
[2] 3GPP- TR 25.996 V10.0.0. Technical Specification
Group Radio Access Network Spatial channel model
for MIMO simulation, (2011-03), (2011).
[3] ETSI TR 138 901 V14.0.0 (2017-05), 5G -Study on
channel model for frequencies from 0.5 to 100 GHz
(3GPP TR 38.901 version 14.0.0 Release 14)
[4] Cheng-Xiang Wang, Ji Bian, Jian Sun, Wensheng
Zhang and Minggao Zhang, ”A Survey of 5G Channel
Measurements and Models” IEEE Communications
surveys and tutorials, 2018
[5] Basim Mohammed Eldowek, Saied, El. Rabaie, Fathi
Samie, “3D Modeling and Analysis of the Space–Time
Correlation for 5G Millimeter Wave MIMO
Channels”, in Wireless Personal Communications ·
November 2018
[6] Samimi, M. K., Sun, S., & Rappaport, T. S, “MIMO
channel modeling and capacity analysis for 5G
millimeter-wave wireless systems”, 10th European
Conference on Antennas and Propagation (EuCAP)
2016, doi:10.1109/eucap.2016.7481507
[7] Omar E .Ayach, et al., “Spatially Sparse Precoding in
Millimeter Wave MIMO Systems“, IEEE Transactions
on Wireless communications Vol. 13, No. 3, March
2014
[8] Yawei Yu, et.al., “3D vs. 2D Channel Models: Spatial
Correlation and Channel Capacity Comparison and
Analysis”, IEEE ICC 2017 Wireless Communications
Symposium
[9] K. Haneda et al., “Indoor 5G 3GPP-like Channel
Models for Office and Shopping Mall Environments,”
to be published in 2016 IEEE International Conference
on Communications Workshops (ICCW), May, 2016.
[10] Shu Sun, et al., “Investigation of Prediction Accuracy,
Sensitivity, and Parameter Stability of Large-Scale
Propagation Path Loss Models for 5G Wireless
Communications”, IEEE Transactions on Vehicular
Technology, Vol 65, Issue 5, 2016.
[11] K. Haneda et al., "Indoor 5G 3GPP-like channel
models for office and shopping mall environments,"
2016 IEEE International Conference on
Communications Workshops (ICC), Kuala Lumpur,
2016, pp. 694-699.
[12] T. S. Rappaport, et al., "Investigation and Comparison
of 3GPP and NYUSIM Channel Models for 5G
Wireless Communications," 2017 IEEE 86th
Vehicular Technology Conference (VTC-Fall),
Toronto, ON, 2017, pp. 1-5.
[13] M. Rumney, P. Kyösti, L. Hentilä, "3GPP channel
model developments for 5G NR requirements and
testing," 12th European Conference on Antennas and
Propagation (EuCAP 2018), London, 2018, pp. 1-5.
[14] V. Díaz and D. M. Aviles, "A Path Loss Simulator for
the 3GPP 5G Channel Models," 2018 IEEE XXV
International Conference on Electronics, Electrical
Engineering and Computing (INTERCON), Lima,
2018, pp. 1-4
 Journal of Science & Technology 144 (2020) 011-016
17
File đính kèm:
 the_study_of_spatial_time_frequency_correlation_properties_o.pdf

