Study and Modeling DNA-Preconcentration Microfluidic Device
In this study, to enhance diagnostic efficiency, we focus on the effect of ion concentration polarization (ICP),
an electroosmotic (EO) flow, electrophoretic (EP) velocity, and the selective membrane length upon the DNA
preconcentration. The study is conducted using the direct simulation of the ions and DNA transport in the
electrokinetic system. The transport process is governed by the system of Poisson-Nernst-Planck-NavierStokes nonlinear equations. Obtained results show the preconcentrating DNA ability in microfluidic devices,
simultaneously point out the impaction of the length of the microchannel and selective membranes on DNA
plug position. Rely on these results, we proposed an experiment model to increase the efficiency of the DNA
preconcentration.
Trang 1
Trang 2
Trang 3
Trang 4
Trang 5
Trang 6
Tóm tắt nội dung tài liệu: Study and Modeling DNA-Preconcentration Microfluidic Device
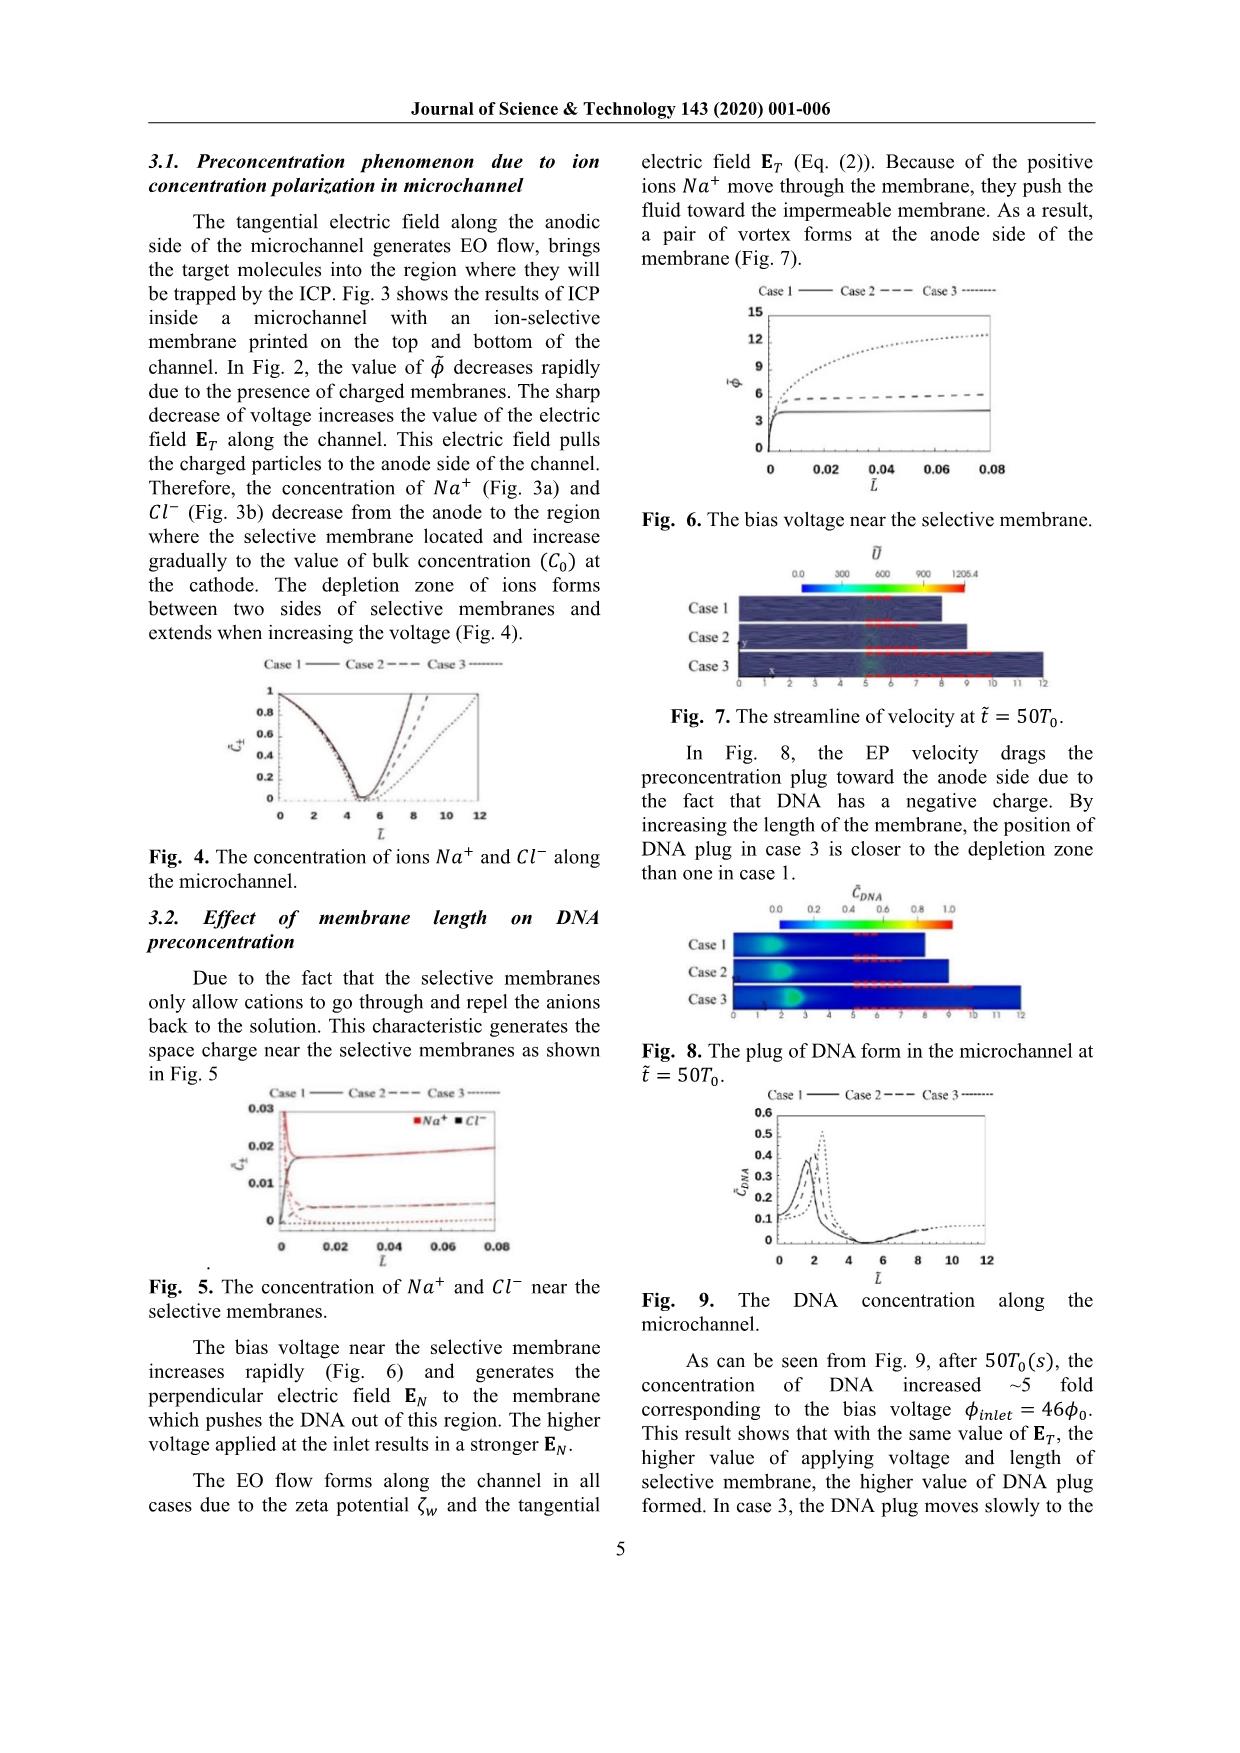
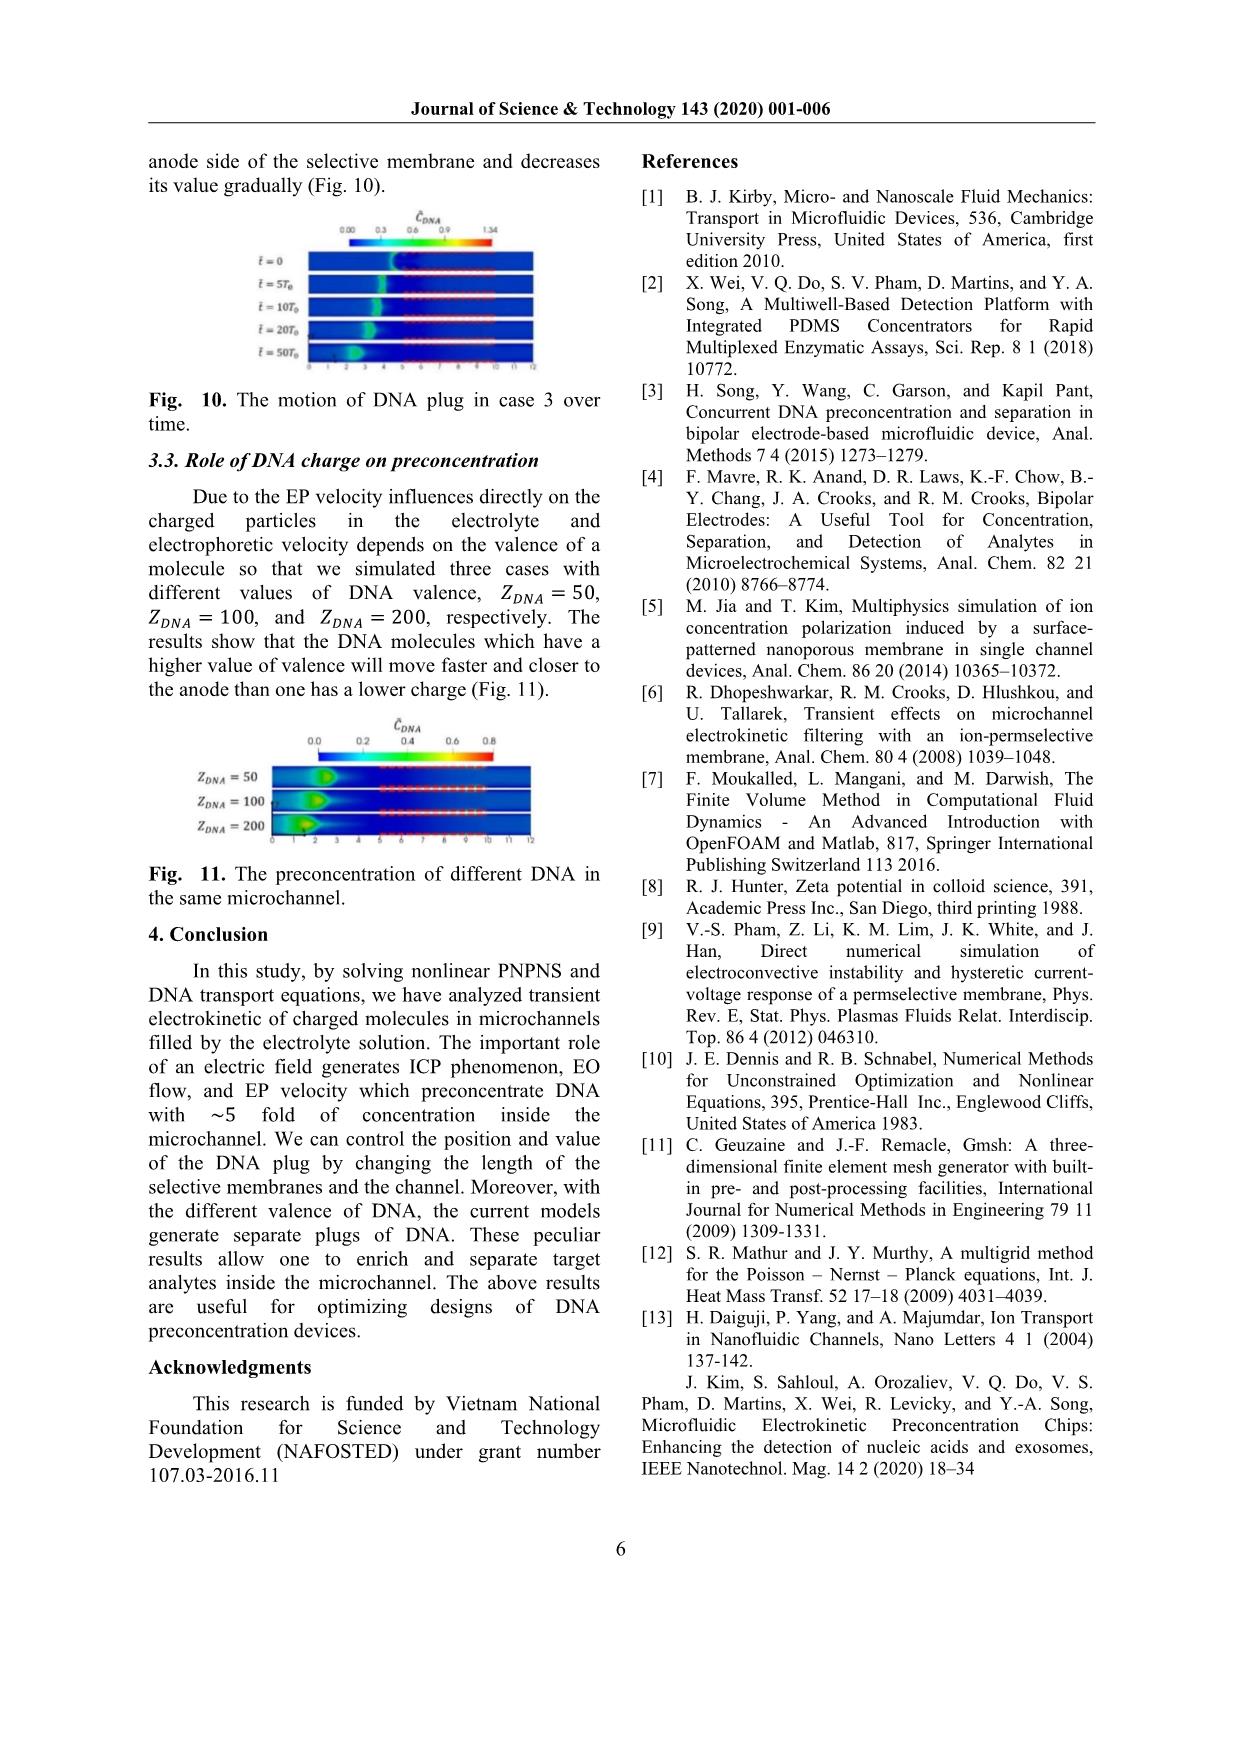
ns is demonstrated by Poisson Eqs. (7) and (8); and the fluid motion is described by the Navier-Stokes Eqs. (9) and (10). Dimensionless form of these equations is as follow: 1 ��� ���± ��̃ = ∇� �± (5) �± = �± �∇���± + �± ��± ∇����+ �����± (6) ��� � ∇� �∇���� = �� (7) �� = ����� + ����� (8) 1 �� 1 ��� �� ��̃ = ∇��� + ∇��� ���� ∇��� 1 ��� � ��∇ ��� (9) ∇� � = 0 (10) where �,̃ ��± , ��, � and �� denote the dimensionless time, concentration of cations (+) and anions (-), electric potential, vector of fluid velocity, and pressure, respectively. These quantities are normalized by the corresponding reference values of time, ionic concentration, electric potential, velocity, and pressure, respectively as follow: �� = �� � �� ;�� = �����;�� = ��� �� ; �� = ������ ��� ;�� = ��� �� (11) where �� is the concentration scale (���/� �), �� is the characteristic length scale (�), �� is the average diffusivity (��/�), �� is the Boltzmann constant, � is the absolute temperature (�), � is the elementary charge (�), and � = ��± � is ion valence. Parameters �± = �± ��⁄ , ��� = �� ��⁄ , and �� = �� ��⁄ are dimensionless diffusion coefficient, the Debye length, and the space charge, respectively. �� = �� �� ��⁄ , �� = � ��⁄ ��, and �� = ���� �� �⁄ are the Péclet number, the Schmidt number, and the Reynolds number, respectively [9]. To investigate DNA preconcentration process in microchannel devices under impaction of the electrical force field and major ions in solution, we need to solve DNA transport equation: 1 ��� ������ ��̃ = ∇� �����∇������ + ���������∇���� + ���� ∇����� (12) where �����, ����, ���� is concentration, diffusivity, and valence of DNA. To determine the diffusivity of DNA, we use empirical relations: ���� ≈ 3 × 10 �����/� � �� 1�� � ��.�� (13) where the contour length, ��, is the arc length of the backbone contour and can be calculated approximately as �� ≈ 0.34�� × ��� (14) with ��� is the number of base pairs of DNA molecules [1]. The contour length �� is the only molecular parameter that significantly affects DNA physical properties in aqueous solutions. As shown in Eq. (13), DNA’s diffusivity is dependent on polymer length, i.e., the number of base pairs. Here, we simulated the preconcentration of DNA which has 25, 50, and 100 base pairs to find out the influence of electrophoresis on DNA transportation in the microchannel. 2.4. Boundary conditions In order to close the Eqs. (5-10), the following boundary conditions were used: At inlet and outlet boundaries, bulk ion concentration boundary �± = 10��; zero gradient boundary condition for DNA concentration; a voltage bias is remained between inlet and outlet to driven ion in the system. At wall boundaries, ���, ���, DNA, and � variables have zero value, while zero gradient condition is applied for � and �. At membrane surface: the concentration of counterion, ���, is fixed at the value of 15��, the no-flux boundary condition is enforced for co-ion, ���. The concentration of ions and DNA was initially set at �± ��� = 10��, ���� = 1��. Regarding the fluid flow, the no-slip boundary condition is enforced on the wall and membrane surface; the free-flow condition is assumed at inlet and outlet. The scales and dimensionless numbers, corresponding with above boundary conditions, are calculated below: �� = 2.381e ��(�);�� = 10(mM);�� = 20�� �� = 2.585e ��(�);�� = 2.66� ��(�/�); �� = 1.183� ��(�/��);�� = 4.356� ��(�); Journal of Science & Technology 143 (2020) 001-006 4 �� = 0.317;�� = 529.762;�� = 5.976��� 2.5. Numerical method In this work, we employed the coupled method proposed by Pham to solve the sets of equations [9]. The finite volume method, a locally conservative method, is used for the discretization of the equations. The nonlinear discretized PNP equations are solved using the Newton-Raphson method [10]. To resolve the rapid variations of the ion concentrations and electric potential near charged surfaces, the mesh near the membrane is extremely refined toward the surfaces. To avoid solving the large system of linear equations and guarantee the strong coupling of the PNP equations, we make use of a coupled method for solving the sets of PNP and NS equations [9]. Starting with a velocity field from the previous iteration or initial condition, the potential and concentrations are simultaneously solved from the PNP equations. Then, electric body force is calculated and substituted into the NS equations. The velocity field obtained by solving the NS equations is substituted back into the PNP equations. The process is repeated until convergence is reached. The DNA equation is solved by coupling with the PNP-NS equations. We used GMSH to generate meshes [11]. Ratio between the largest and smallest cell is 1530. We validated the accuracy of the numerical method by comparing the numerical solution to the analytical solution and solution published in the papers of electric potential on a solid surface interfacing with an electrolyte solution [12-13]. The potential can be calculated using the well-known Grahame equation, �������� = 2��� � ��� �� � �� (8�0���������)�/� � (15) To examine the effect of mesh nonorthogonality on the simulation result, we consider two mesh types including an orthogonal mesh (consisting of rectangular control volume), a non-orthogonal mesh (consisting of triangular control volumes). Parameters used in the simulation include the bulk concentration with different values (0.1��, 1 ��, 10��), surface charge, temperature � = 300�, and the ion diffusivities. The numerical and exact solutions for the surface potential at different bulk concentration are presented in Table 1. From the results, we can see a good agreement between the exact solution and the numerical solution for both orthogonal and non- orthogonal meshes. This agreement demonstrates the high accuracy of our numerical solution. Table 1. The computed surface potential and ion concentration in comparison with published data. ����� (��) ��������� (��) ��������� (��) ��������� (��) � (��) � (��) Orthogonal Non- orthogonal Marthur and Murthy [12] Daiguji et al. [13] 0.1 -39.5 -39.52 -39.5 -39.58 -39.5 1 -13.5 -13.6 -13.62 -13.63 -13.7 10 -4.34 -4.35 -4.43 -4.42 -4.56 3. Results and discussion In their experimental work, Kim and his co- workers used a microchannel with 1 �� in length at voltage 50�, this model generates the electric field of 5000 �/� [14]. In this study, we simulated a shorter microchannel with the smaller bias voltages to maintain the same electric field in the experiment. We simulated three cases with different length of membranes �� � = 1��, �� � = 2��, �� � = 5��; the bias voltage � applied at the inlet are 31��, 35��, and 46��, respectively (Fig. 2). The dimensionless length of the microchannel is denoted as ��. The number of cells in each case is 15504, 16864, and 19584, respectively. The red dashed lines present the selective membranes. Fig. 2. The bias voltages along the microchannel Fig. 3. The ICP at � =̃ 50�� in microchannels Journal of Science & Technology 143 (2020) 001-006 5 3.1. Preconcentration phenomenon due to ion concentration polarization in microchannel The tangential electric field along the anodic side of the microchannel generates EO flow, brings the target molecules into the region where they will be trapped by the ICP. Fig. 3 shows the results of ICP inside a microchannel with an ion-selective membrane printed on the top and bottom of the channel. In Fig. 2, the value of �� decreases rapidly due to the presence of charged membranes. The sharp decrease of voltage increases the value of the electric field �� along the channel. This electric field pulls the charged particles to the anode side of the channel. Therefore, the concentration of ��� (Fig. 3a) and ��� (Fig. 3b) decrease from the anode to the region where the selective membrane located and increase gradually to the value of bulk concentration (��) at the cathode. The depletion zone of ions forms between two sides of selective membranes and extends when increasing the voltage (Fig. 4). Fig. 4. The concentration of ions ��� and ��� along the microchannel. 3.2. Effect of membrane length on DNA preconcentration Due to the fact that the selective membranes only allow cations to go through and repel the anions back to the solution. This characteristic generates the space charge near the selective membranes as shown in Fig. 5 . Fig. 5. The concentration of ��� and ��� near the selective membranes. The bias voltage near the selective membrane increases rapidly (Fig. 6) and generates the perpendicular electric field �� to the membrane which pushes the DNA out of this region. The higher voltage applied at the inlet results in a stronger ��. The EO flow forms along the channel in all cases due to the zeta potential �� and the tangential electric field �� (Eq. (2)). Because of the positive ions ��� move through the membrane, they push the fluid toward the impermeable membrane. As a result, a pair of vortex forms at the anode side of the membrane (Fig. 7). Fig. 6. The bias voltage near the selective membrane. Fig. 7. The streamline of velocity at � =̃ 50��. In Fig. 8, the EP velocity drags the preconcentration plug toward the anode side due to the fact that DNA has a negative charge. By increasing the length of the membrane, the position of DNA plug in case 3 is closer to the depletion zone than one in case 1. Fig. 8. The plug of DNA form in the microchannel at � =̃ 50��. Fig. 9. The DNA concentration along the microchannel. As can be seen from Fig. 9, after 50��(�), the concentration of DNA increased ~5 fold corresponding to the bias voltage ������ = 46��. This result shows that with the same value of ��, the higher value of applying voltage and length of selective membrane, the higher value of DNA plug formed. In case 3, the DNA plug moves slowly to the Journal of Science & Technology 143 (2020) 001-006 6 anode side of the selective membrane and decreases its value gradually (Fig. 10). Fig. 10. The motion of DNA plug in case 3 over time. 3.3. Role of DNA charge on preconcentration Due to the EP velocity influences directly on the charged particles in the electrolyte and electrophoretic velocity depends on the valence of a molecule so that we simulated three cases with different values of DNA valence, ���� = 50, ���� = 100, and ���� = 200, respectively. The results show that the DNA molecules which have a higher value of valence will move faster and closer to the anode than one has a lower charge (Fig. 11). Fig. 11. The preconcentration of different DNA in the same microchannel. 4. Conclusion In this study, by solving nonlinear PNPNS and DNA transport equations, we have analyzed transient electrokinetic of charged molecules in microchannels filled by the electrolyte solution. The important role of an electric field generates ICP phenomenon, EO flow, and EP velocity which preconcentrate DNA with ~5 fold of concentration inside the microchannel. We can control the position and value of the DNA plug by changing the length of the selective membranes and the channel. Moreover, with the different valence of DNA, the current models generate separate plugs of DNA. These peculiar results allow one to enrich and separate target analytes inside the microchannel. The above results are useful for optimizing designs of DNA preconcentration devices. Acknowledgments This research is funded by Vietnam National Foundation for Science and Technology Development (NAFOSTED) under grant number 107.03-2016.11 References [1] B. J. Kirby, Micro- and Nanoscale Fluid Mechanics: Transport in Microfluidic Devices, 536, Cambridge University Press, United States of America, first edition 2010. [2] X. Wei, V. Q. Do, S. V. Pham, D. Martins, and Y. A. Song, A Multiwell-Based Detection Platform with Integrated PDMS Concentrators for Rapid Multiplexed Enzymatic Assays, Sci. Rep. 8 1 (2018) 10772. [3] H. Song, Y. Wang, C. Garson, and Kapil Pant, Concurrent DNA preconcentration and separation in bipolar electrode-based microfluidic device, Anal. Methods 7 4 (2015) 1273–1279. [4] F. Mavre, R. K. Anand, D. R. Laws, K.-F. Chow, B.- Y. Chang, J. A. Crooks, and R. M. Crooks, Bipolar Electrodes: A Useful Tool for Concentration, Separation, and Detection of Analytes in Microelectrochemical Systems, Anal. Chem. 82 21 (2010) 8766–8774. [5] M. Jia and T. Kim, Multiphysics simulation of ion concentration polarization induced by a surface- patterned nanoporous membrane in single channel devices, Anal. Chem. 86 20 (2014) 10365–10372. [6] R. Dhopeshwarkar, R. M. Crooks, D. Hlushkou, and U. Tallarek, Transient effects on microchannel electrokinetic filtering with an ion-permselective membrane, Anal. Chem. 80 4 (2008) 1039–1048. [7] F. Moukalled, L. Mangani, and M. Darwish, The Finite Volume Method in Computational Fluid Dynamics - An Advanced Introduction with OpenFOAM and Matlab, 817, Springer International Publishing Switzerland 113 2016. [8] R. J. Hunter, Zeta potential in colloid science, 391, Academic Press Inc., San Diego, third printing 1988. [9] V.-S. Pham, Z. Li, K. M. Lim, J. K. White, and J. Han, Direct numerical simulation of electroconvective instability and hysteretic current- voltage response of a permselective membrane, Phys. Rev. E, Stat. Phys. Plasmas Fluids Relat. Interdiscip. Top. 86 4 (2012) 046310. [10] J. E. Dennis and R. B. Schnabel, Numerical Methods for Unconstrained Optimization and Nonlinear Equations, 395, Prentice-Hall Inc., Englewood Cliffs, United States of America 1983. [11] C. Geuzaine and J.-F. Remacle, Gmsh: A three- dimensional finite element mesh generator with built- in pre- and post-processing facilities, International Journal for Numerical Methods in Engineering 79 11 (2009) 1309-1331. [12] S. R. Mathur and J. Y. Murthy, A multigrid method for the Poisson – Nernst – Planck equations, Int. J. Heat Mass Transf. 52 17–18 (2009) 4031–4039. [13] H. Daiguji, P. Yang, and A. Majumdar, Ion Transport in Nanofluidic Channels, Nano Letters 4 1 (2004) 137-142. J. Kim, S. Sahloul, A. Orozaliev, V. Q. Do, V. S. Pham, D. Martins, X. Wei, R. Levicky, and Y.-A. Song, Microfluidic Electrokinetic Preconcentration Chips: Enhancing the detection of nucleic acids and exosomes, IEEE Nanotechnol. Mag. 14 2 (2020) 18–34
File đính kèm:
 study_and_modeling_dna_preconcentration_microfluidic_device.pdf

