Production efficiency analysis of indigenous pig production in Northwest Vietnam
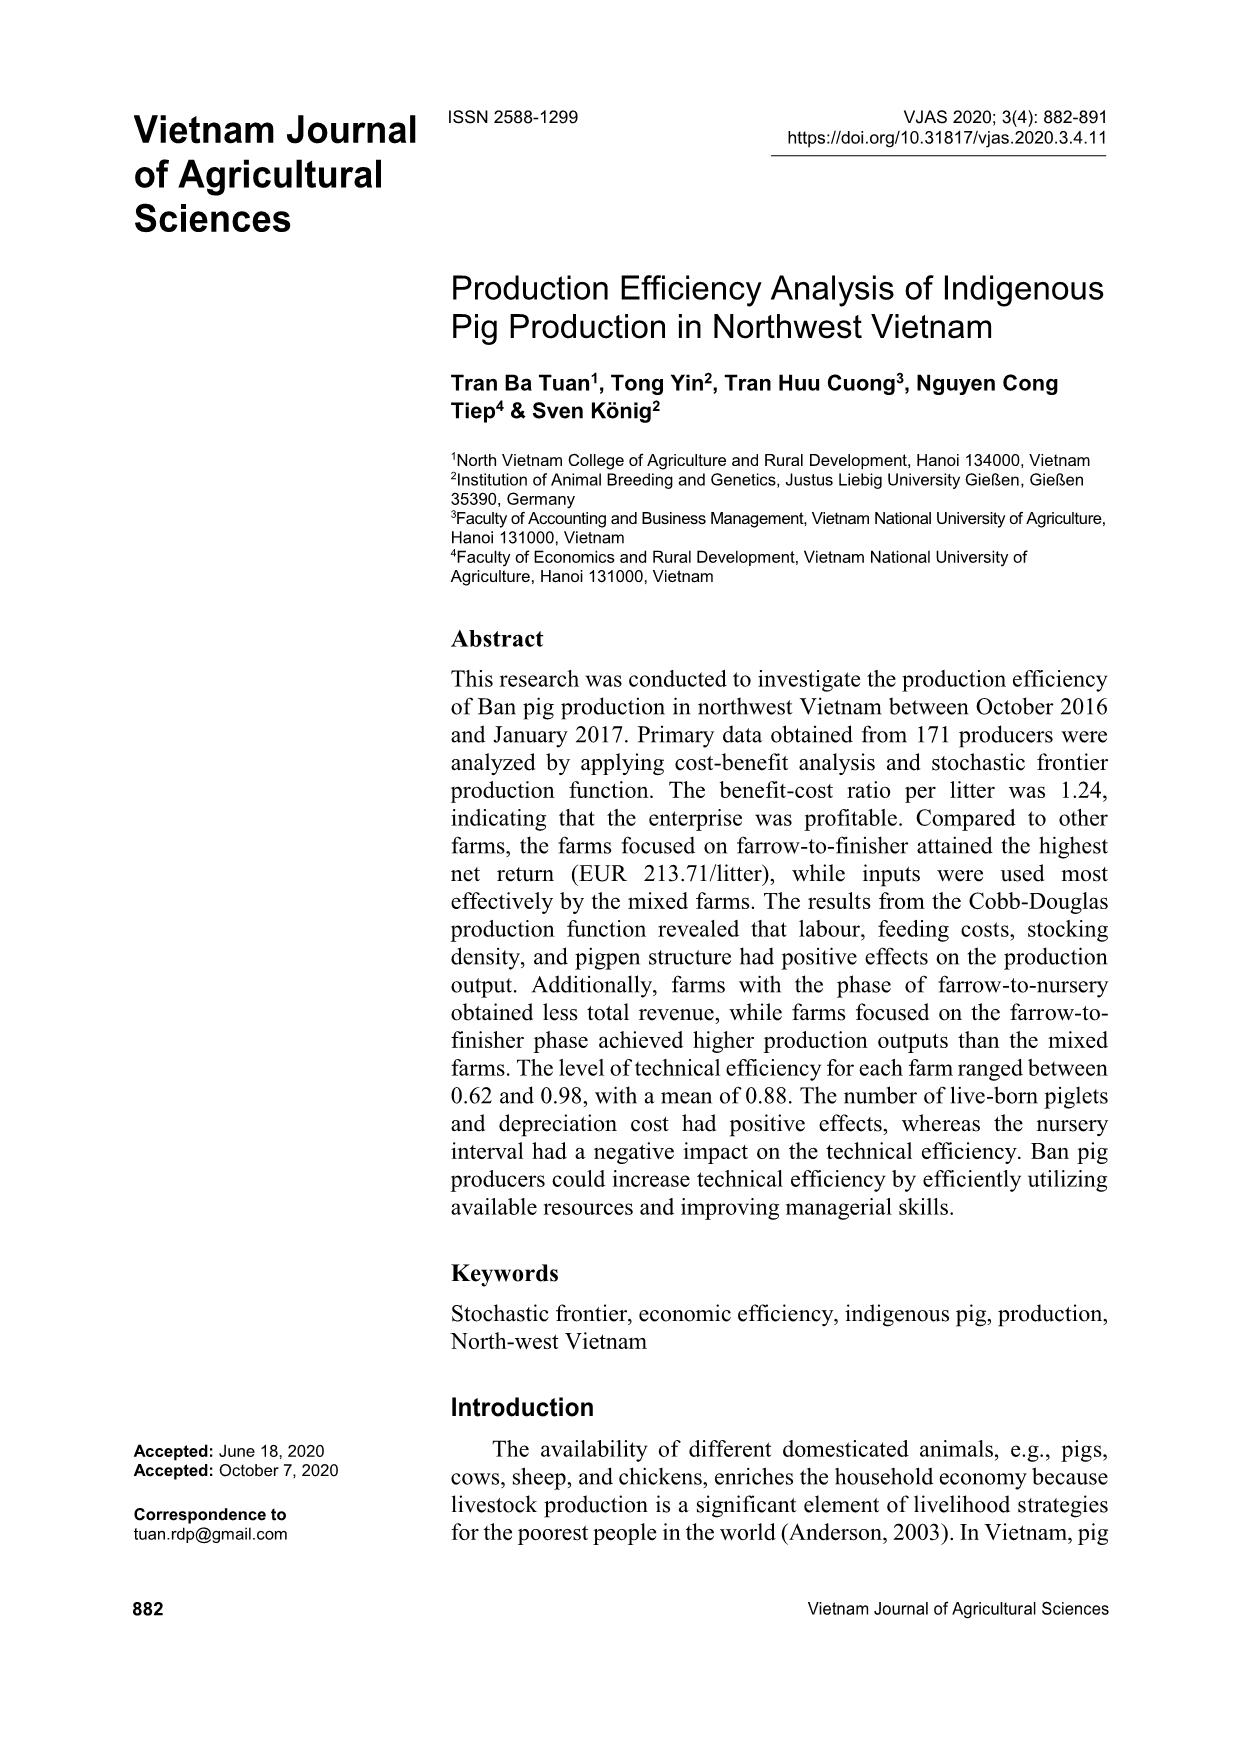
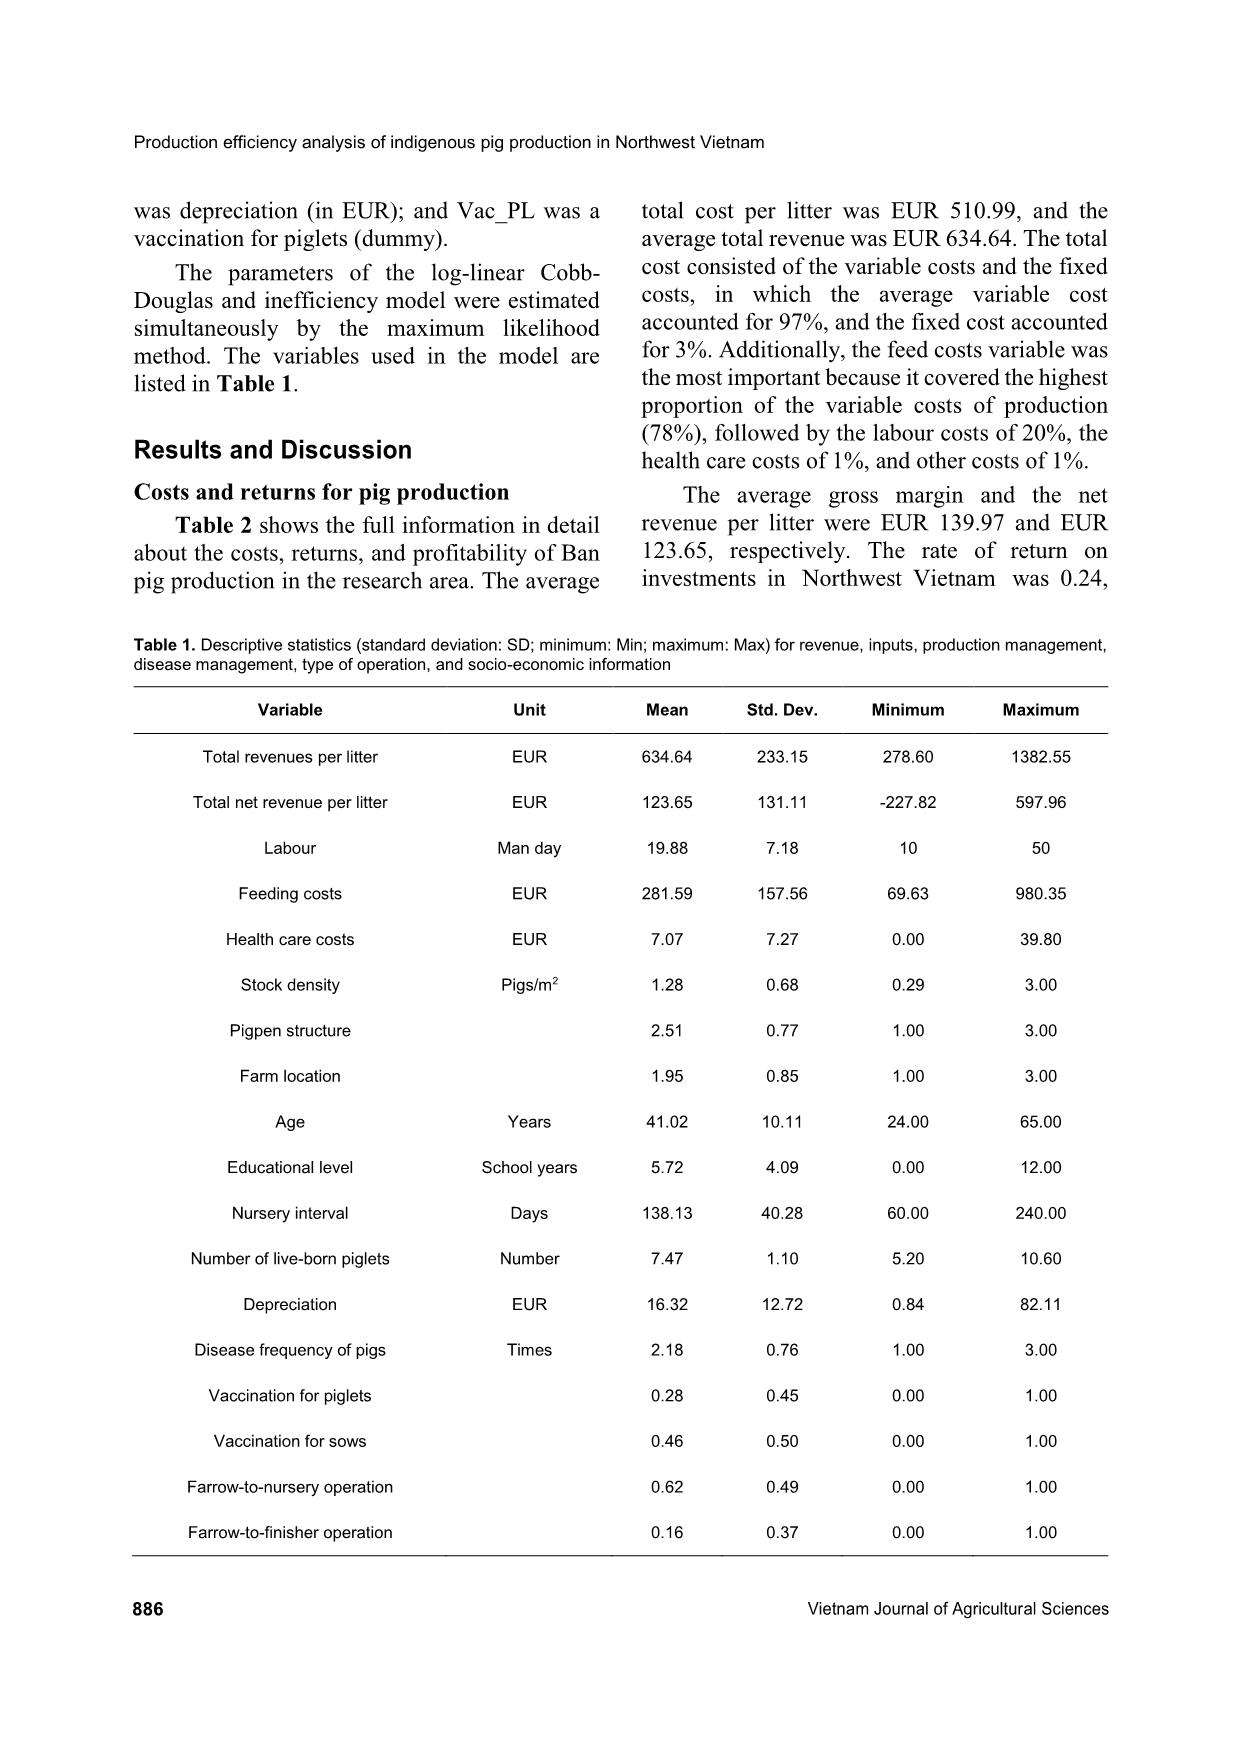
This research was conducted to investigate the production efficiency
of Ban pig production in northwest Vietnam between October 2016
and January 2017. Primary data obtained from 171 producers were
analyzed by applying cost-benefit analysis and stochastic frontier
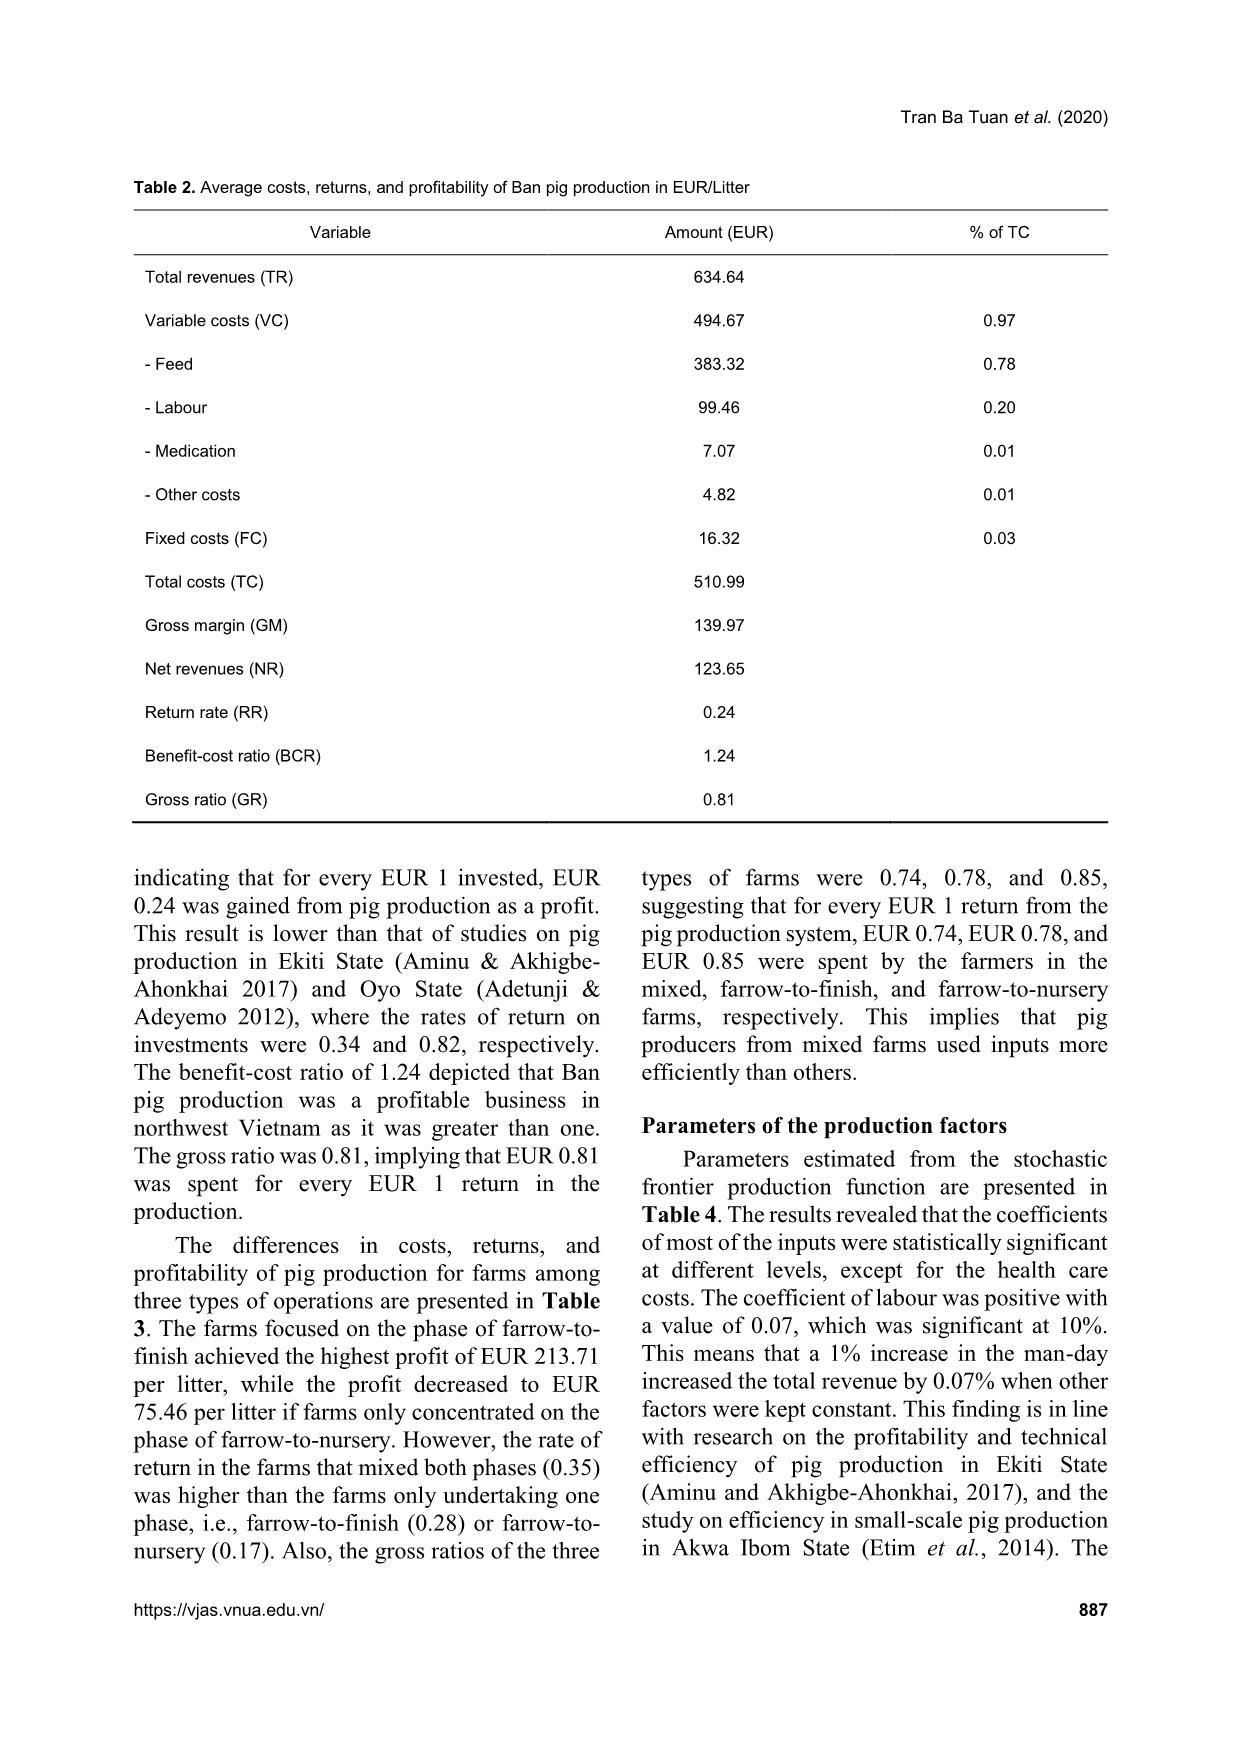
production function. The benefit-cost ratio per litter was 1.24,
indicating that the enterprise was profitable. Compared to other
farms, the farms focused on farrow-to-finisher attained the highest
net return (EUR 213.71/litter), while inputs were used most
effectively by the mixed farms. The results from the Cobb-Douglas
production function revealed that labour, feeding costs, stocking
density, and pigpen structure had positive effects on the production
output. Additionally, farms with the phase of farrow-to-nursery
obtained less total revenue, while farms focused on the farrow-tofinisher phase achieved higher production outputs than the mixed
farms. The level of technical efficiency for each farm ranged between
0.62 and 0.98, with a mean of 0.88. The number of live-born piglets
and depreciation cost had positive effects, whereas the nursery
interval had a negative impact on the technical efficiency. Ban pig
producers could increase technical efficiency by efficiently utilizing
available resources and improving managerial skills.
Trang 1
Trang 2
Trang 3
Trang 4
Trang 5
Trang 6
Trang 7
Trang 8
Trang 9
Trang 10
Tóm tắt nội dung tài liệu: Production efficiency analysis of indigenous pig production in Northwest Vietnam
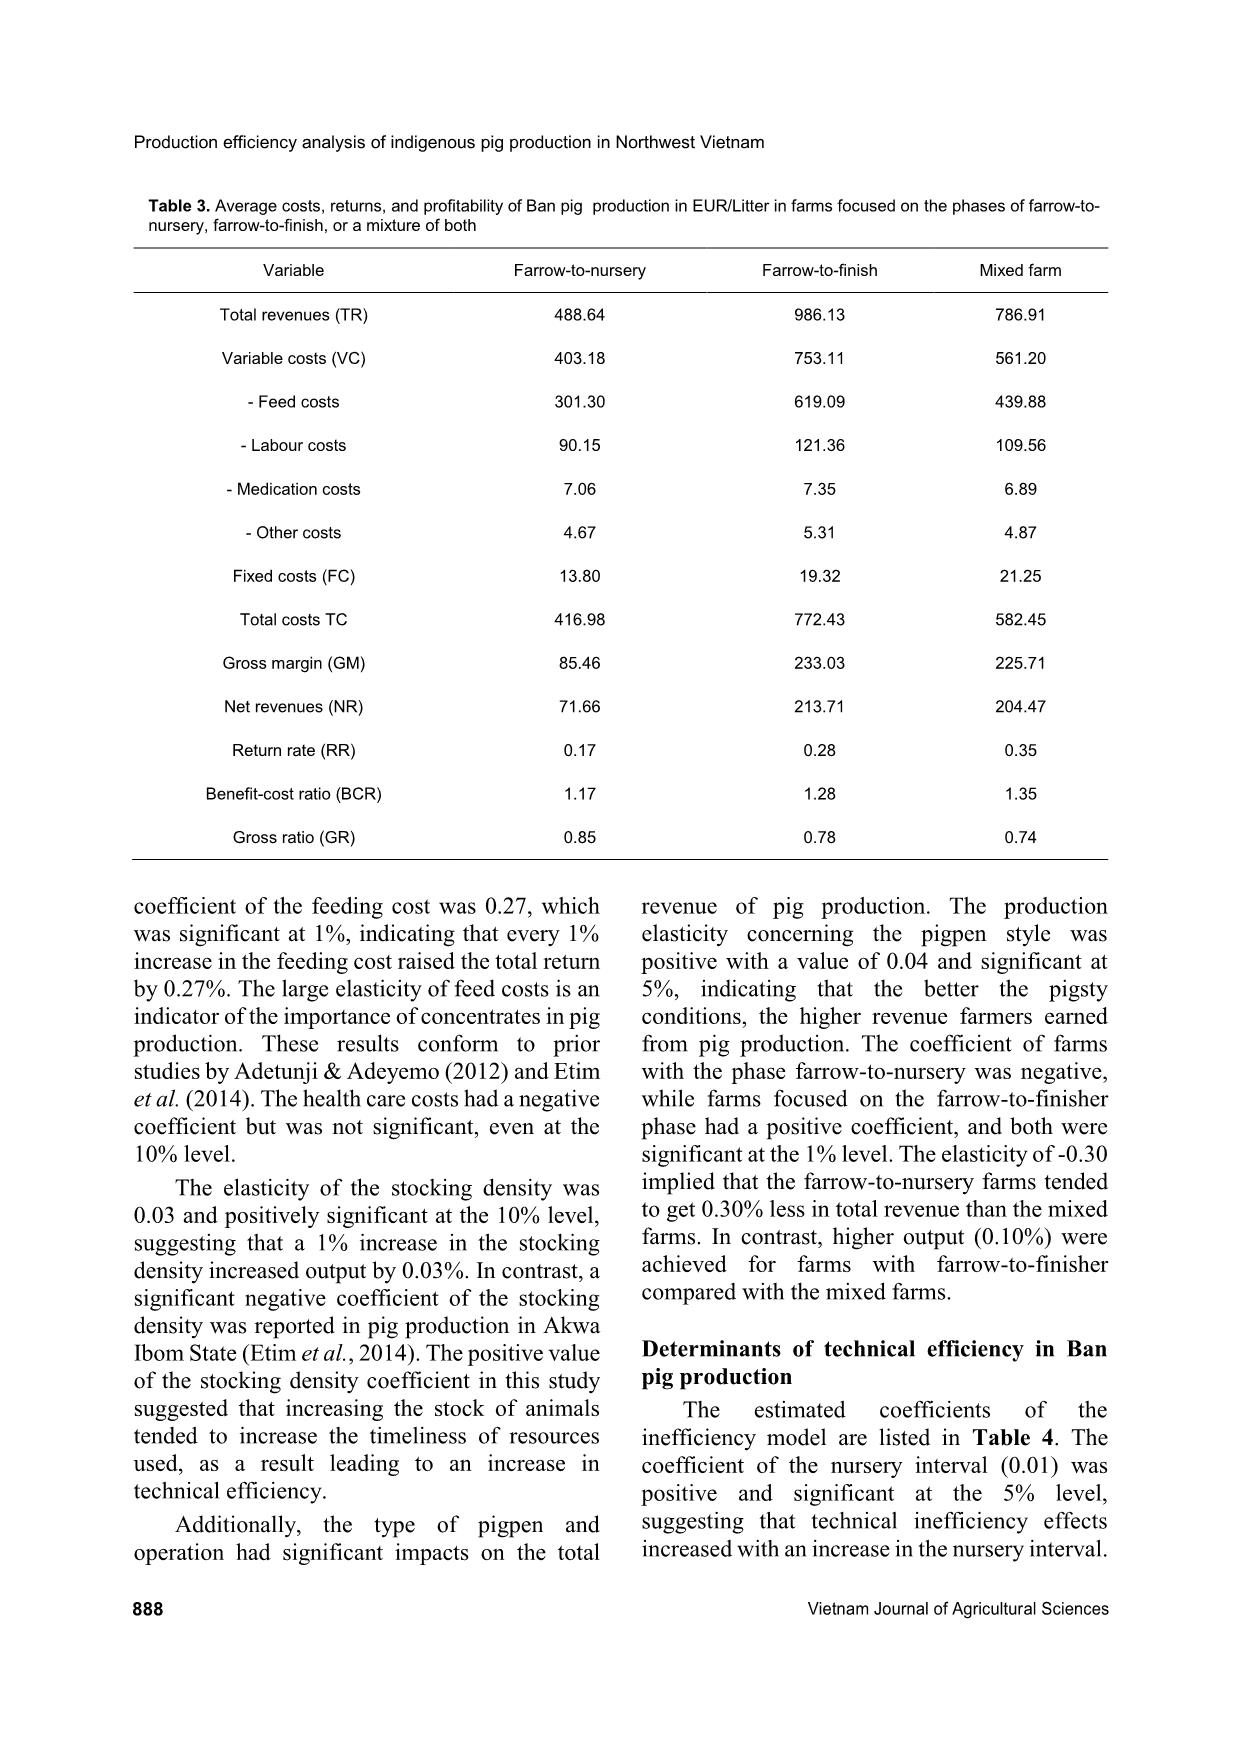
UR 213.71
per litter, while the profit decreased to EUR
75.46 per litter if farms only concentrated on the
phase of farrow-to-nursery. However, the rate of
return in the farms that mixed both phases (0.35)
was higher than the farms only undertaking one
phase, i.e., farrow-to-finish (0.28) or farrow-to-
nursery (0.17). Also, the gross ratios of the three
types of farms were 0.74, 0.78, and 0.85,
suggesting that for every EUR 1 return from the
pig production system, EUR 0.74, EUR 0.78, and
EUR 0.85 were spent by the farmers in the
mixed, farrow-to-finish, and farrow-to-nursery
farms, respectively. This implies that pig
producers from mixed farms used inputs more
efficiently than others.
Parameters of the production factors
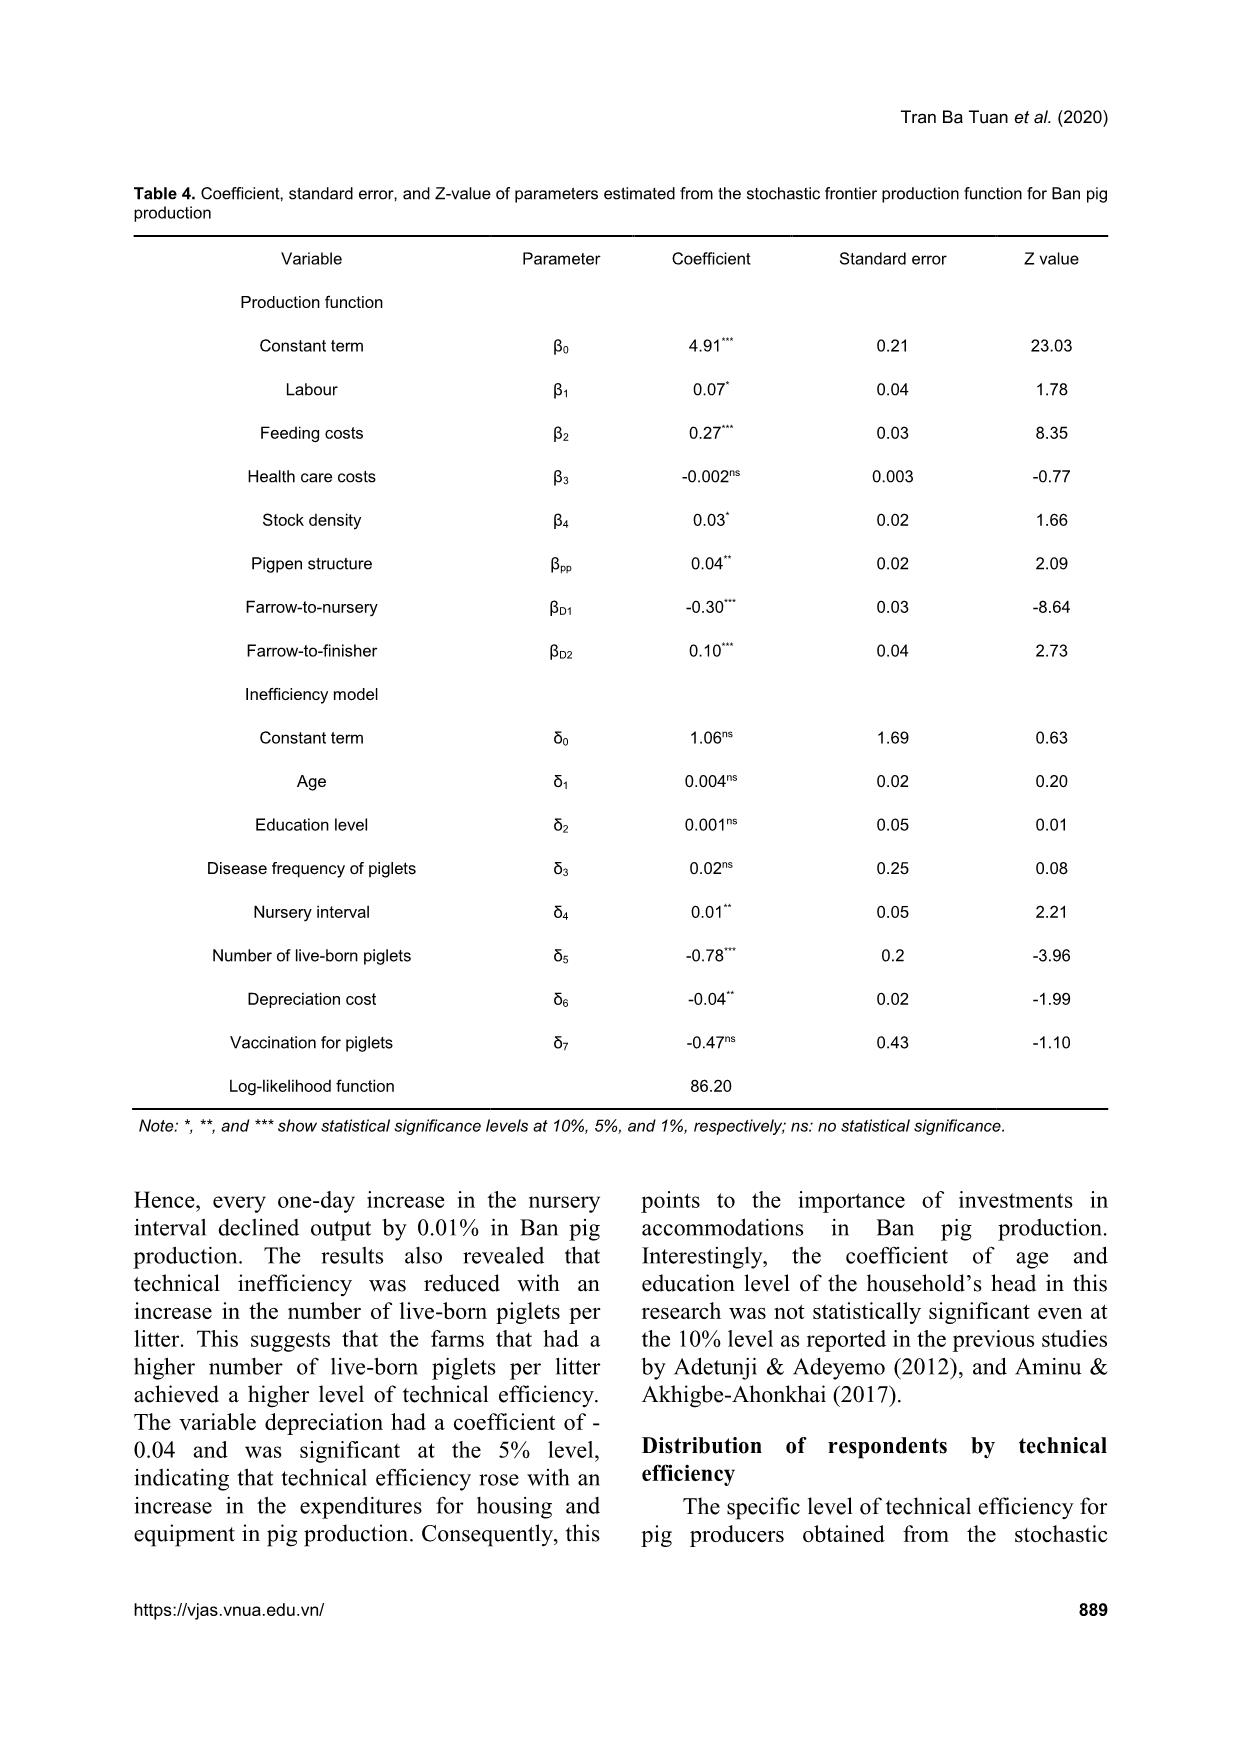
Parameters estimated from the stochastic
frontier production function are presented in
Table 4. The results revealed that the coefficients
of most of the inputs were statistically significant
at different levels, except for the health care
costs. The coefficient of labour was positive with
a value of 0.07, which was significant at 10%.
This means that a 1% increase in the man-day
increased the total revenue by 0.07% when other
factors were kept constant. This finding is in line
with research on the profitability and technical
efficiency of pig production in Ekiti State
(Aminu and Akhigbe-Ahonkhai, 2017), and the
study on efficiency in small-scale pig production
in Akwa Ibom State (Etim et al., 2014). The
Production efficiency analysis of indigenous pig production in Northwest Vietnam
888 Vietnam Journal of Agricultural Sciences
Table 3. Average costs, returns, and profitability of Ban pig production in EUR/Litter in farms focused on the phases of farrow-to-
nursery, farrow-to-finish, or a mixture of both
Variable Farrow-to-nursery Farrow-to-finish Mixed farm
Total revenues (TR) 488.64 986.13 786.91
Variable costs (VC) 403.18 753.11 561.20
- Feed costs 301.30 619.09 439.88
- Labour costs 90.15 121.36 109.56
- Medication costs 7.06 7.35 6.89
- Other costs 4.67 5.31 4.87
Fixed costs (FC) 13.80 19.32 21.25
Total costs TC 416.98 772.43 582.45
Gross margin (GM) 85.46 233.03 225.71
Net revenues (NR) 71.66 213.71 204.47
Return rate (RR) 0.17 0.28 0.35
Benefit-cost ratio (BCR) 1.17 1.28 1.35
Gross ratio (GR) 0.85 0.78 0.74
coefficient of the feeding cost was 0.27, which
was significant at 1%, indicating that every 1%
increase in the feeding cost raised the total return
by 0.27%. The large elasticity of feed costs is an
indicator of the importance of concentrates in pig
production. These results conform to prior
studies by Adetunji & Adeyemo (2012) and Etim
et al. (2014). The health care costs had a negative
coefficient but was not significant, even at the
10% level.
The elasticity of the stocking density was
0.03 and positively significant at the 10% level,
suggesting that a 1% increase in the stocking
density increased output by 0.03%. In contrast, a
significant negative coefficient of the stocking
density was reported in pig production in Akwa
Ibom State (Etim et al., 2014). The positive value
of the stocking density coefficient in this study
suggested that increasing the stock of animals
tended to increase the timeliness of resources
used, as a result leading to an increase in
technical efficiency.
Additionally, the type of pigpen and
operation had significant impacts on the total
revenue of pig production. The production
elasticity concerning the pigpen style was
positive with a value of 0.04 and significant at
5%, indicating that the better the pigsty
conditions, the higher revenue farmers earned
from pig production. The coefficient of farms
with the phase farrow-to-nursery was negative,
while farms focused on the farrow-to-finisher
phase had a positive coefficient, and both were
significant at the 1% level. The elasticity of -0.30
implied that the farrow-to-nursery farms tended
to get 0.30% less in total revenue than the mixed
farms. In contrast, higher output (0.10%) were
achieved for farms with farrow-to-finisher
compared with the mixed farms.
Determinants of technical efficiency in Ban
pig production
The estimated coefficients of the
inefficiency model are listed in Table 4. The
coefficient of the nursery interval (0.01) was
positive and significant at the 5% level,
suggesting that technical inefficiency effects
increased with an increase in the nursery interval.
Tran Ba Tuan et al. (2020)
https://vjas.vnua.edu.vn/ 889
Table 4. Coefficient, standard error, and Z-value of parameters estimated from the stochastic frontier production function for Ban pig
production
Variable Parameter Coefficient Standard error Z value
Production function
Constant term β0 4.91
*** 0.21 23.03
Labour β1 0.07
* 0.04 1.78
Feeding costs β2 0.27
*** 0.03 8.35
Health care costs β3 -0.002
ns 0.003 -0.77
Stock density β4 0.03
* 0.02 1.66
Pigpen structure βpp 0.04
** 0.02 2.09
Farrow-to-nursery βD1 -0.30
*** 0.03 -8.64
Farrow-to-finisher βD2 0.10
*** 0.04 2.73
Inefficiency model
Constant term δ0 1.06
ns 1.69 0.63
Age δ1 0.004
ns 0.02 0.20
Education level δ2 0.001
ns 0.05 0.01
Disease frequency of piglets δ3 0.02
ns 0.25 0.08
Nursery interval δ4 0.01
** 0.05 2.21
Number of live-born piglets δ5 -0.78
*** 0.2 -3.96
Depreciation cost δ6 -0.04
** 0.02 -1.99
Vaccination for piglets δ7 -0.47
ns 0.43 -1.10
Log-likelihood function 86.20
 Note: *, **, and *** show statistical significance levels at 10%, 5%, and 1%, respectively; ns: no statistical significance.
Hence, every one-day increase in the nursery
interval declined output by 0.01% in Ban pig
production. The results also revealed that
technical inefficiency was reduced with an
increase in the number of live-born piglets per
litter. This suggests that the farms that had a
higher number of live-born piglets per litter
achieved a higher level of technical efficiency.
The variable depreciation had a coefficient of -
0.04 and was significant at the 5% level,
indicating that technical efficiency rose with an
increase in the expenditures for housing and
equipment in pig production. Consequently, this
points to the importance of investments in
accommodations in Ban pig production.
Interestingly, the coefficient of age and
education level of the household’s head in this
research was not statistically significant even at
the 10% level as reported in the previous studies
by Adetunji & Adeyemo (2012), and Aminu &
Akhigbe-Ahonkhai (2017).
Distribution of respondents by technical
efficiency
The specific level of technical efficiency for
pig producers obtained from the stochastic
Production efficiency analysis of indigenous pig production in Northwest Vietnam
890 Vietnam Journal of Agricultural Sciences
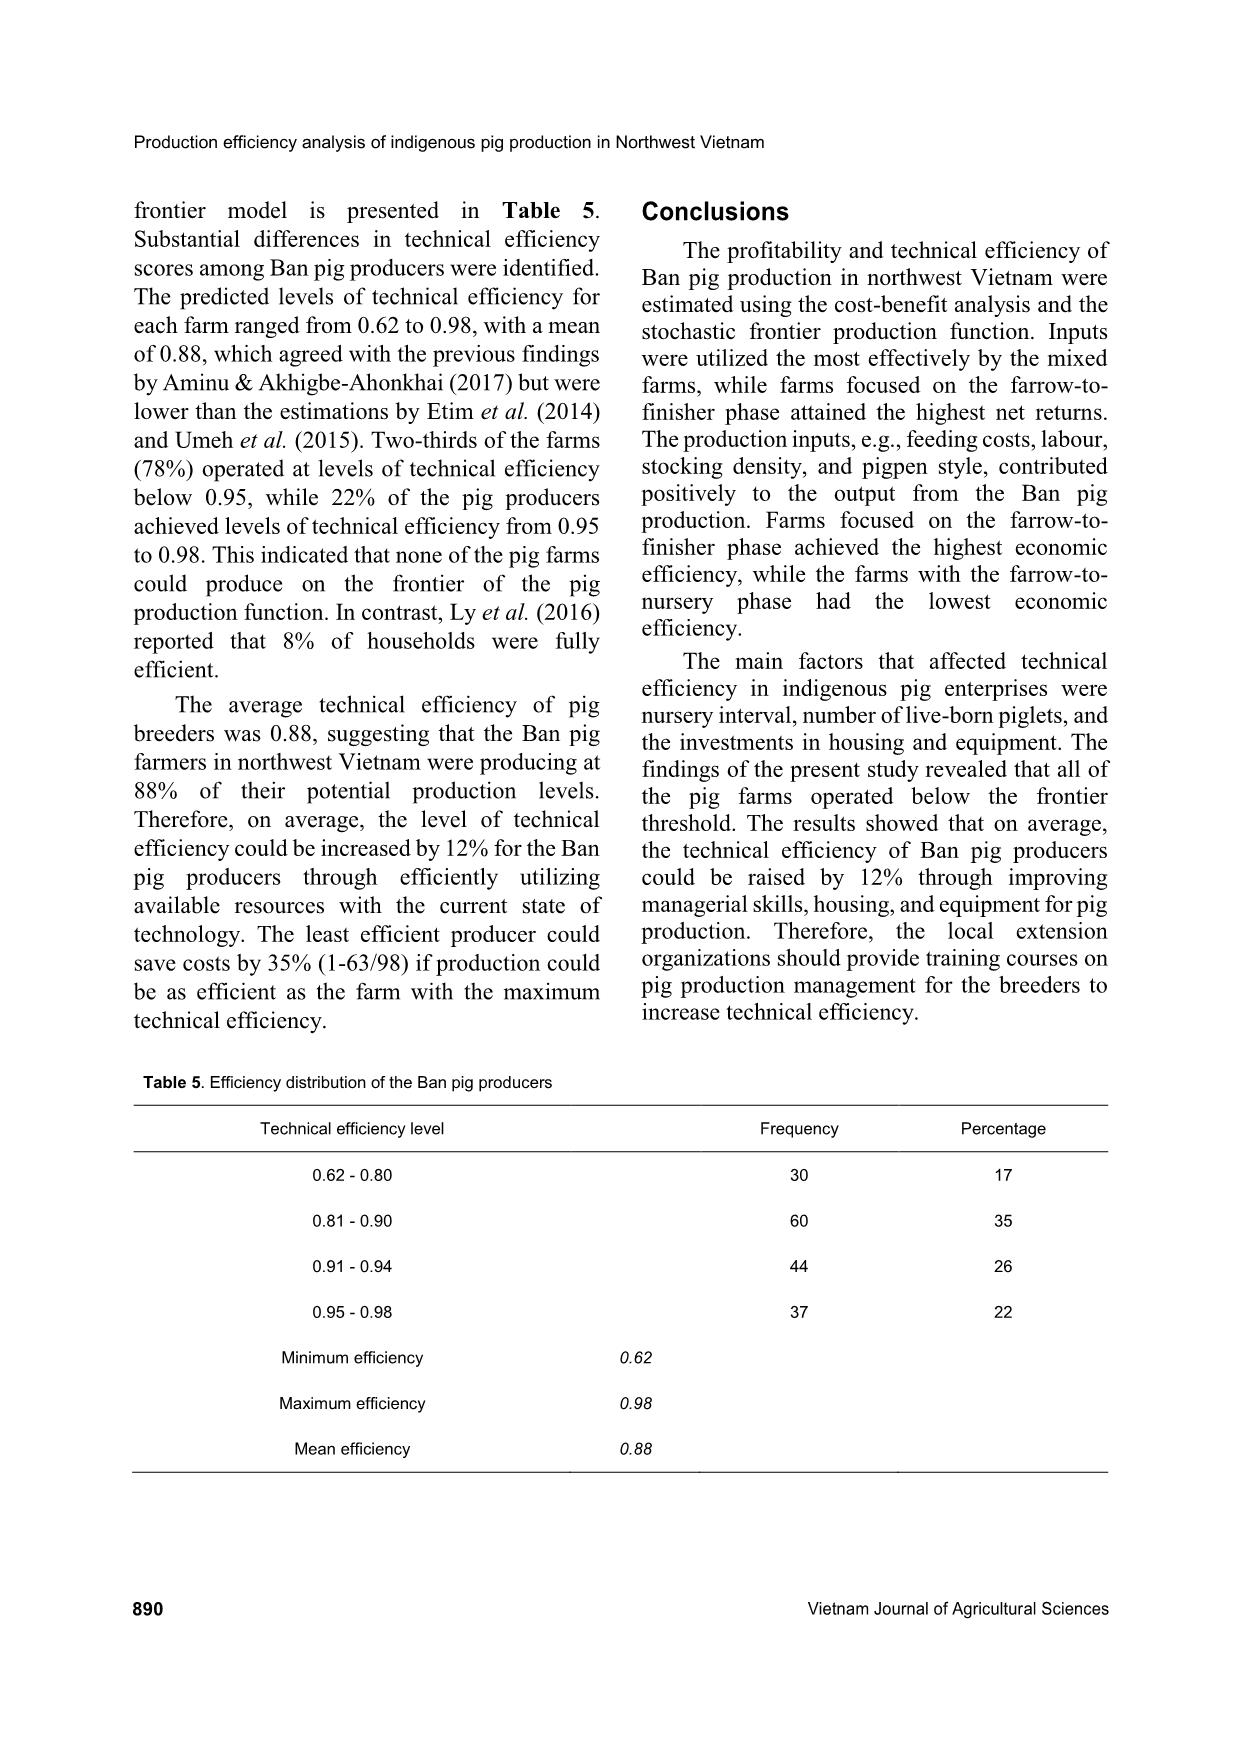
frontier model is presented in Table 5.
Substantial differences in technical efficiency
scores among Ban pig producers were identified.
The predicted levels of technical efficiency for
each farm ranged from 0.62 to 0.98, with a mean
of 0.88, which agreed with the previous findings
by Aminu & Akhigbe-Ahonkhai (2017) but were
lower than the estimations by Etim et al. (2014)
and Umeh et al. (2015). Two-thirds of the farms
(78%) operated at levels of technical efficiency
below 0.95, while 22% of the pig producers
achieved levels of technical efficiency from 0.95
to 0.98. This indicated that none of the pig farms
could produce on the frontier of the pig
production function. In contrast, Ly et al. (2016)
reported that 8% of households were fully
efficient.
The average technical efficiency of pig
breeders was 0.88, suggesting that the Ban pig
farmers in northwest Vietnam were producing at
88% of their potential production levels.
Therefore, on average, the level of technical
efficiency could be increased by 12% for the Ban
pig producers through efficiently utilizing
available resources with the current state of
technology. The least efficient producer could
save costs by 35% (1-63/98) if production could
be as efficient as the farm with the maximum
technical efficiency.
Conclusions
The profitability and technical efficiency of
Ban pig production in northwest Vietnam were
estimated using the cost-benefit analysis and the
stochastic frontier production function. Inputs
were utilized the most effectively by the mixed
farms, while farms focused on the farrow-to-
finisher phase attained the highest net returns.
The production inputs, e.g., feeding costs, labour,
stocking density, and pigpen style, contributed
positively to the output from the Ban pig
production. Farms focused on the farrow-to-
finisher phase achieved the highest economic
efficiency, while the farms with the farrow-to-
nursery phase had the lowest economic
efficiency.
The main factors that affected technical
efficiency in indigenous pig enterprises were
nursery interval, number of live-born piglets, and
the investments in housing and equipment. The
findings of the present study revealed that all of
the pig farms operated below the frontier
threshold. The results showed that on average,
the technical efficiency of Ban pig producers
could be raised by 12% through improving
managerial skills, housing, and equipment for pig
production. Therefore, the local extension
organizations should provide training courses on
pig production management for the breeders to
increase technical efficiency.
 Table 5. Efficiency distribution of the Ban pig producers
Technical efficiency level Frequency Percentage
0.62 - 0.80 30 17
0.81 - 0.90 60 35
0.91 - 0.94 44 26
0.95 - 0.98 37 22
Minimum efficiency 0.62
Maximum efficiency 0.98
Mean efficiency 0.88
 https://vjas.vnua.edu.vn/ 891
Acknowledgments
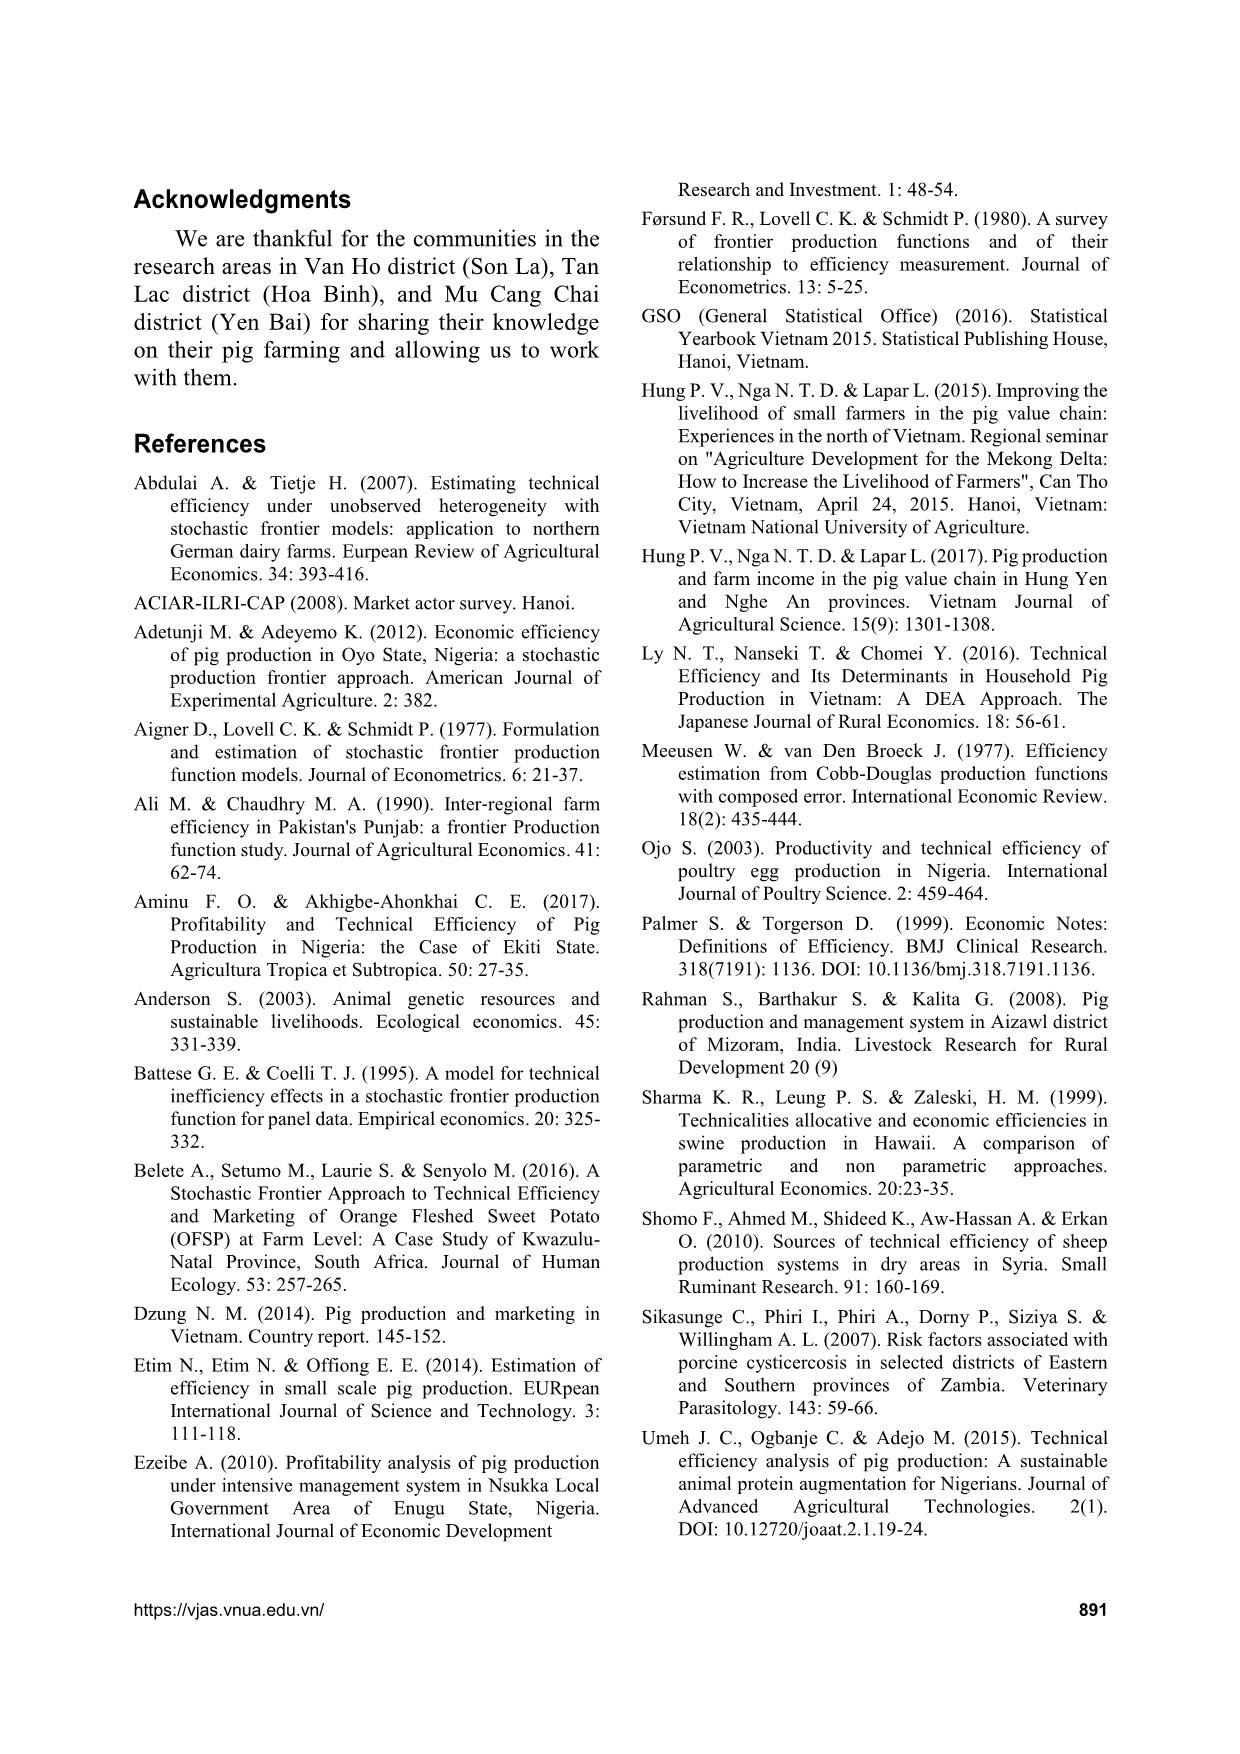
We are thankful for the communities in the
research areas in Van Ho district (Son La), Tan
Lac district (Hoa Binh), and Mu Cang Chai
district (Yen Bai) for sharing their knowledge
on their pig farming and allowing us to work
with them.
References
Abdulai A. & Tietje H. (2007). Estimating technical
efficiency under unobserved heterogeneity with
stochastic frontier models: application to northern
German dairy farms. Eurpean Review of Agricultural
Economics. 34: 393-416.
ACIAR-ILRI-CAP (2008). Market actor survey. Hanoi.
Adetunji M. & Adeyemo K. (2012). Economic efficiency
of pig production in Oyo State, Nigeria: a stochastic
production frontier approach. American Journal of
Experimental Agriculture. 2: 382.
Aigner D., Lovell C. K. & Schmidt P. (1977). Formulation
and estimation of stochastic frontier production
function models. Journal of Econometrics. 6: 21-37.
Ali M. & Chaudhry M. A. (1990). Inter‐regional farm
efficiency in Pakistan's Punjab: a frontier Production
function study. Journal of Agricultural Economics. 41:
62-74.
Aminu F. O. & Akhigbe-Ahonkhai C. E. (2017).
Profitability and Technical Efficiency of Pig
Production in Nigeria: the Case of Ekiti State.
Agricultura Tropica et Subtropica. 50: 27-35.
Anderson S. (2003). Animal genetic resources and
sustainable livelihoods. Ecological economics. 45:
331-339.
Battese G. E. & Coelli T. J. (1995). A model for technical
inefficiency effects in a stochastic frontier production
function for panel data. Empirical economics. 20: 325-
332.
Belete A., Setumo M., Laurie S. & Senyolo M. (2016). A
Stochastic Frontier Approach to Technical Efficiency
and Marketing of Orange Fleshed Sweet Potato
(OFSP) at Farm Level: A Case Study of Kwazulu-
Natal Province, South Africa. Journal of Human
Ecology. 53: 257-265.
Dzung N. M. (2014). Pig production and marketing in
Vietnam. Country report. 145-152.
Etim N., Etim N. & Offiong E. E. (2014). Estimation of
efficiency in small scale pig production. EURpean
International Journal of Science and Technology. 3:
111-118.
Ezeibe A. (2010). Profitability analysis of pig production
under intensive management system in Nsukka Local
Government Area of Enugu State, Nigeria.
International Journal of Economic Development
Research and Investment. 1: 48-54.
Førsund F. R., Lovell C. K. & Schmidt P. (1980). A survey
of frontier production functions and of their
relationship to efficiency measurement. Journal of
Econometrics. 13: 5-25.
GSO (General Statistical Office) (2016). Statistical
Yearbook Vietnam 2015. Statistical Publishing House,
Hanoi, Vietnam.
Hung P. V., Nga N. T. D. & Lapar L. (2015). Improving the
livelihood of small farmers in the pig value chain:
Experiences in the north of Vietnam. Regional seminar
on "Agriculture Development for the Mekong Delta:
How to Increase the Livelihood of Farmers", Can Tho
City, Vietnam, April 24, 2015. Hanoi, Vietnam:
Vietnam National University of Agriculture.
Hung P. V., Nga N. T. D. & Lapar L. (2017). Pig production
and farm income in the pig value chain in Hung Yen
and Nghe An provinces. Vietnam Journal of
Agricultural Science. 15(9): 1301-1308.
Ly N. T., Nanseki T. & Chomei Y. (2016). Technical
Efficiency and Its Determinants in Household Pig
Production in Vietnam: A DEA Approach. The
Japanese Journal of Rural Economics. 18: 56-61.
Meeusen W. & van Den Broeck J. (1977). Efficiency
estimation from Cobb-Douglas production functions
with composed error. International Economic Review.
18(2): 435-444.
Ojo S. (2003). Productivity and technical efficiency of
poultry egg production in Nigeria. International
Journal of Poultry Science. 2: 459-464.
Palmer S. & Torgerson D. (1999). Economic Notes:
Definitions of Efficiency. BMJ Clinical Research.
318(7191): 1136. DOI: 10.1136/bmj.318.7191.1136.
Rahman S., Barthakur S. & Kalita G. (2008). Pig
production and management system in Aizawl district
of Mizoram, India. Livestock Research for Rural
Development 20 (9)
Sharma K. R., Leung P. S. & Zaleski, H. M. (1999).
Technicalities allocative and economic efficiencies in
swine production in Hawaii. A comparison of
parametric and non parametric approaches.
Agricultural Economics. 20:23-35.
Shomo F., Ahmed M., Shideed K., Aw-Hassan A. & Erkan
O. (2010). Sources of technical efficiency of sheep
production systems in dry areas in Syria. Small
Ruminant Research. 91: 160-169.
Sikasunge C., Phiri I., Phiri A., Dorny P., Siziya S. &
Willingham A. L. (2007). Risk factors associated with
porcine cysticercosis in selected districts of Eastern
and Southern provinces of Zambia. Veterinary
Parasitology. 143: 59-66.
Umeh J. C., Ogbanje C. & Adejo M. (2015). Technical
efficiency analysis of pig production: A sustainable
animal protein augmentation for Nigerians. Journal of
Advanced Agricultural Technologies. 2(1).
DOI: 10.12720/joaat.2.1.19-24.
File đính kèm:
 production_efficiency_analysis_of_indigenous_pig_production.pdf

