Phương pháp đếm giấy xếp chồng dựa trên sự kết hợp độ cong cực tiểu và phát hiện đỉnh
Laminated sheet detection plays an extreme role in the manufacturing field of sheet products such
as paper, cigarette package, packing box, PCB and so on.The precision of this processing directly
affects the economic benefit of the factory and the subsequent production operation. However, the major
abtacles in this term such as the thickness of paper, material, inhomogeneous illumination, density of
noises still challenge the recent approaches. To overcome these problems, the method which combines
minimum curvature and peak detection is presented. First, the profiles of the stacked papers along the
vertical orientation of the paper are extracted. The curvatures of the profiles then are calculated after
applying Gaussian filter. Later, the central lines of the stacked papers need to be detected. The width
of the region where the curvature is negative represents the thickness of the paper. Afterward, the
positions of stacked papers can be corrected by judging the distance between the two adjacent center
points and the gray features. Finally, the counting result can be acquired by performing peak detection
on the ridge image. Our algorithm can accurately detect the abnormal paper by fusing the gray features
of the stacked papers and the distance of adjacent paper. Experimental results show that the error rate
of our method is less than 0.01% for the paper with the thickness between 0.05 mm and 0.2 mm.
Trang 1
Trang 2
Trang 3
Trang 4
Trang 5
Trang 6

Trang 7

Trang 8
Tóm tắt nội dung tài liệu: Phương pháp đếm giấy xếp chồng dựa trên sự kết hợp độ cong cực tiểu và phát hiện đỉnh
value is dark overall, resulting in a
change in the gray profile curve. The curvature
values are all greater than zero. There is no local
minimum value, and the point will be missed, so it
needs to be corrected.
Since the thickness of the paper is constant, the
distance between two adjacent sheets should
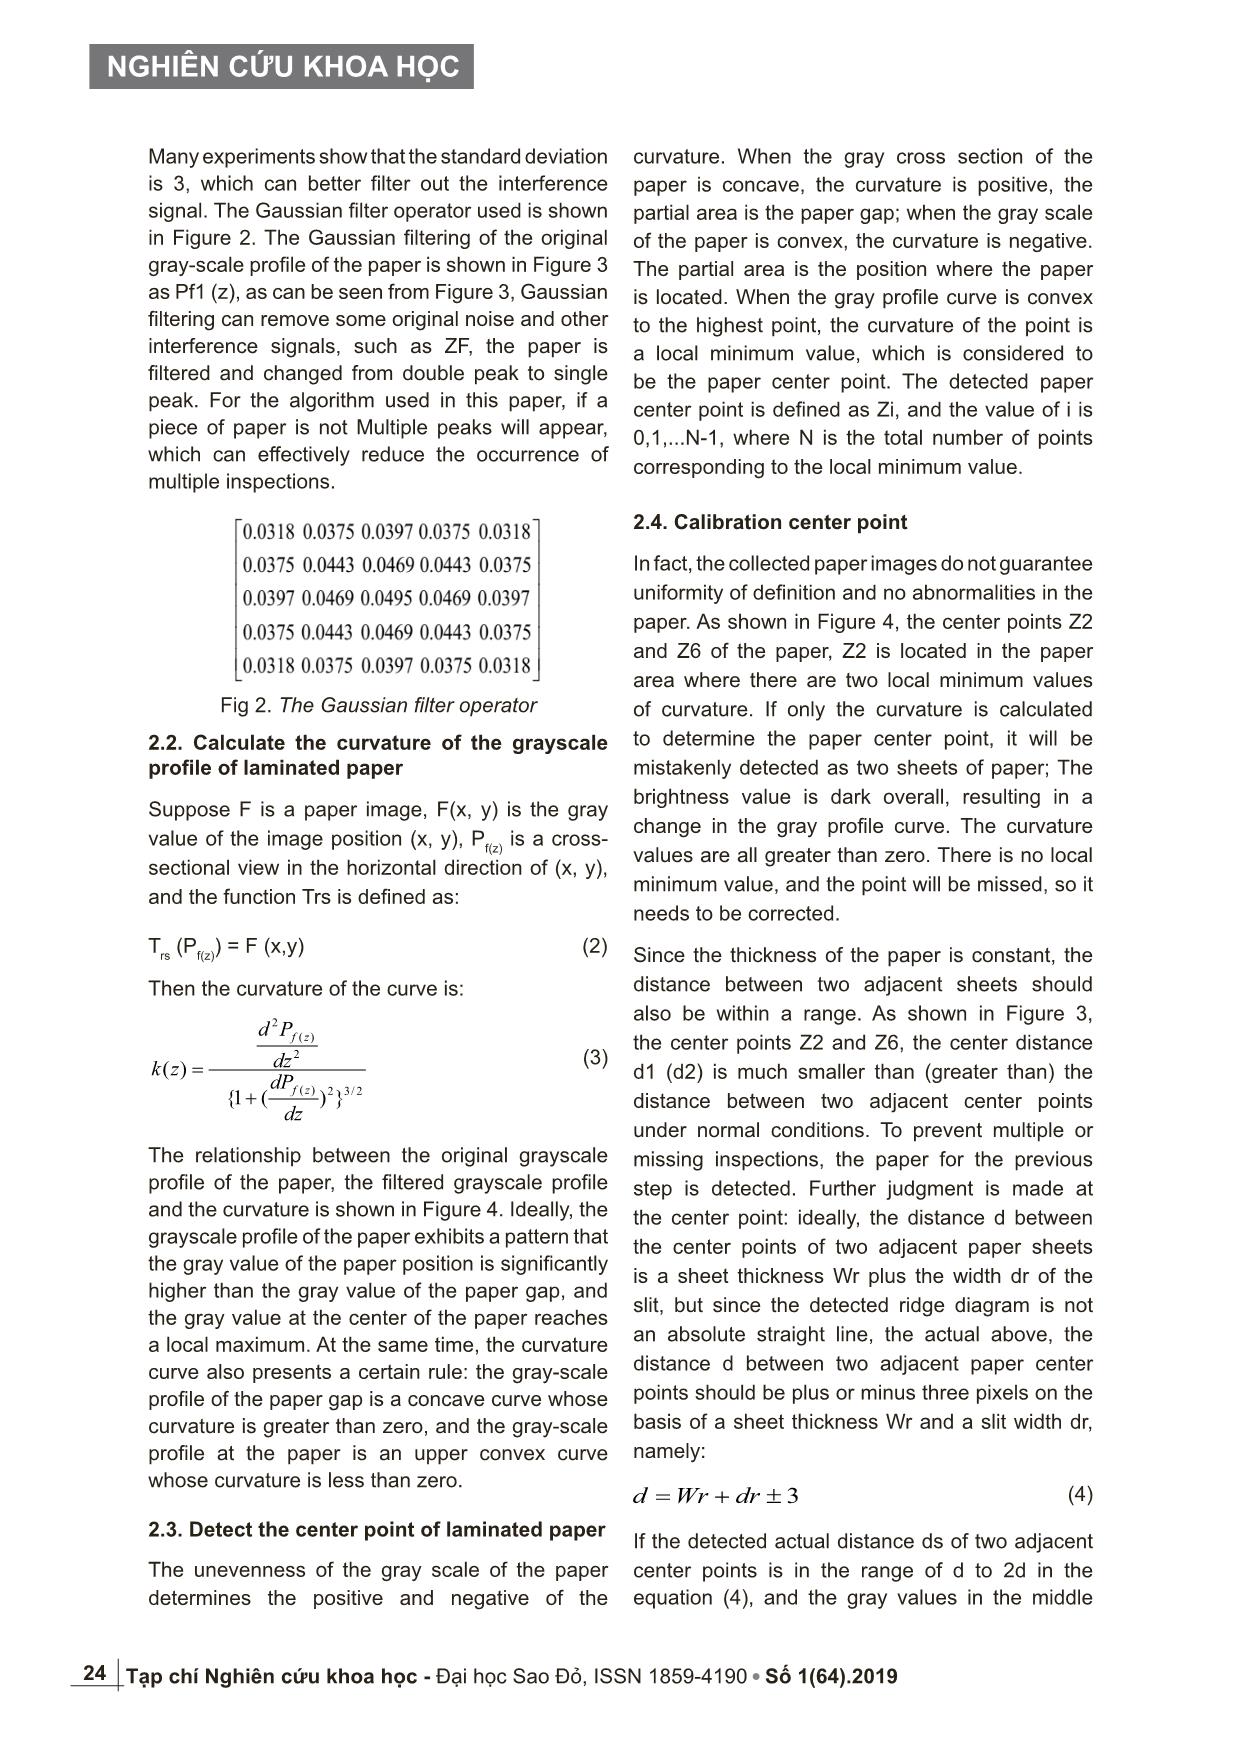
also be within a range. As shown in Figure 3,
the center points Z2 and Z6, the center distance
d1 (d2) is much smaller than (greater than) the
distance between two adjacent center points
under normal conditions. To prevent multiple or
missing inspections, the paper for the previous
step is detected. Further judgment is made at
the center point: ideally, the distance d between
the center points of two adjacent paper sheets
is a sheet thickness Wr plus the width dr of the
slit, but since the detected ridge diagram is not
an absolute straight line, the actual above, the
distance d between two adjacent paper center
points should be plus or minus three pixels on the
basis of a sheet thickness Wr and a slit width dr,
namely:
(4)
If the detected actual distance ds of two adjacent
center points is in the range of d to 2d in the
equation (4), and the gray values in the middle
2/32)(
2
)(
2
})(1{
)(
dz
dP
dz
Pd
zk
zf
zf
+
=
3±+= drWrd
25
LIÊN NGÀNH ĐIỆN - ĐIỆN TỬ - TỰ ĐỘNG HÓA
Tạp chí Nghiên cứu khoa học - Đại học Sao Đỏ, ISSN 1859-4190 Số 1(64).2019
position of the two adjacent center points and one
pixel in the left and right if it is greater than 70, it is
considered that a piece of paper has been missed
between the detected two center points; similarly,
if the ds of two adjacent center points detected
are within the range of 2d to 3d in the formula
(4), and in the one-third and two-thirds positions
of the two adjacent center points and the gray
value in the left and right pixels are greater than
70, it is considered that two sheets of paper have
been missed between the detected two center
points. And so on to judge the situation of missed
detection.
Fig.3.The relationship of the original profile,
filtered profile and curvature
If the detected actual distance ds of two adjacent
center points is smaller than d in the equation
(4), the distance between the point and another
adjacent center point is further determined, if the
point is adjacent to the two center points. If the
sum of the distances is less than d, the point is
considered to be the center point of the multi-
check and is removed.
When it is determined that two adjacent center
points have missed a piece of paper, the curvature
values of the intermediate positions of the two
adjacent center points are reversed; when it
is determined that two adjacent center points
have been detected, two sheets are missed. For
paper, the curvature values of the one-third and
two-thirds of the two adjacent center points are
reversed; and so on. The curvature value of the
missed inspection is treated as in equation (5):
The relationship of the original profile Pf(z), filtered
profile Pf1(z) and curvature k(z) (Z1, Z2’ (multi-
detection), Z2, Z3, Z4, Z5, Z6 (less-detection), Z7
represent the paper center respectively. dr, ds(d1,
d2), Wr is the width of the gap, the distance of the
two adjacent centers and the width of the paper
respectively).
+−=+
+−=+
+−=+
)1()1(
....
)1()1(
)1()1(
22
n
k
n
k
n
k
n
k
n
k
n
k
ss
ss
ss
dndn
dd
dd
(5)
Experiments have shown that after calibration, the
missing or multi-checked paper can be detected
very well.
2.5. Count the paper with peak detection
In [14], the detected ridge line results are
counted one by one by pixel, which is not only
time-consuming, computationally intensive, but
also cannot be correctly counted for non-absolute
straight lines. In order to prevent inaccurate
counting, the ridge line count is used in the peak
detection method [15-16].
Fig 4. (a) The acquired ridge line result;
(b) Result of the peak detection
It can be seen from Figure 3 Pf(z) that the original
paper has large fluctuations in the grayscale
(b)
(a)
Z1 Z2 Z3 Z4 Z5 Z6 Z7
26
NGHIÊN CỨU KHOA HỌC
Tạp chí Nghiên cứu khoa học - Đại học Sao Đỏ, ISSN 1859-4190 Số 1(64).2019
profile due to some external disturbances such
as noise. If the peak value is directly detected,
it is easy to cause false detection and multiple
inspections. The result of the paper ridge obtained
by the minimum curvature method is as shown in
Figure 4.(b), and the cross-sectional view is neat
and regular, and there is no fluctuation. When the
detected ridge diagram appears broken.
When cracking or non-absolute straight line,
in order to reduce its influence on the detection
result, calculate the average value of each ridge
line as the value of the ridge line, and then perform
peak search on the processed paper ridge line, as
shown in Figure 4. For the processed paper ridge
diagram, the peak position is the center point of
the paper, and the peak number is the stack paper
count result. Experiments show that this method
can effectively reduce the interference of external
noise such as noise, and when the ridge line breaks
or the ridge line is non-absolute straight line, it can
also reduce its influence on the counting result.
3. EXPERIMENT
Paper will inevitably have some abnormal
conditions, such as uneven end faces, wide
gaps, adhesions and foreign matter, as shown in
Figure 5.
For the papers of the four anomalies in Figure 4,
the fast linear growth algorithm (LSD) [9] and the
frequency domain are used in the literature.
(a) (b) (c) (d)
Fig 5. Abnormal papers ((a), (b), (c) and (d) are the
irregular papers, wide-gap papers, sticky papers
and impure papers respectively)
For the papers of the four anomalies in Figure
5, the fast linear growth algorithm (LSD) [9] in
the literature and the combination of frequency
domain analysis and correlation metrics [10] and
the uncorrected algorithm and the algorithm in this
paper are used.
Detection, the test results are shown in Figure 6.
As can be seen from Fig. 6, for the LSD algorithm
in (a), since it is based on the gradient field of the
paper image, some of the papers in (a1), (a2), and
(a3) are dark, or paper. The change from the gap
is not obvious. In the paper (a4), there is foreign
matter on the paper to make the gradient change
abnormally, so the algorithm will cause some
Fig 6. ((a1)-(a4), (b1)-(b4), (c1)-(c4) and (d1)-(d4) are the detectingresult of four kinds of abnormal
paper using LSD algorithm, frequency domain analysis and correlation measurement algorithm,
our uncorrected algorithm and our algorithm respectively represent the paper that is missed or extra)
(a1) (a2) (a3) (a4)
(b1) (b2) (b3) (b4)
(c1) (c2) (c3) (c4)
(d1) (d2) (d3) (d4)
27
LIÊN NGÀNH ĐIỆN - ĐIỆN TỬ - TỰ ĐỘNG HÓA
Tạp chí Nghiên cứu khoa học - Đại học Sao Đỏ, ISSN 1859-4190 Số 1(64).2019
papers (a1), (a2) and (a3) to be missed. (a4) For
the case of multiple detection; for the frequency
domain analysis and correlation metric algorithm
in (b), the comb filter used is easy to cause
misdetection for paper with local periodic anomaly,
and the correlation metric is for weak implicit modal
signals. It is easy to cause missed detection,
so the algorithm will lead to (b1), (b2), (b3) and
(b4) miss detection and multiple detection; (c) in
this paper uncorrected algorithm, for paper with
abnormal grayscale changes. The paper area may
have no minimum value of curvature, such as A in
(c1), (c2), (c3), and (c4), which makes it easy to
miss the paper. Or a sheet of paper with multiple
curvature minimum values, such as B in (c2), which
makes it easier to check the paper. The correction
algorithm in (d), on the basis of (c), combines the
grayscale characteristics of the paper with the
information of the distance of the adjacent paper
to further judge the detected paper, and fills the
missing paper, and the paper that is checked
more. Removed, which improves the accuracy
of paper detection. At the same time, in order
to further verify the accuracy of the algorithm,
different types of paper with thickness between
0.05 mm and 0.2 mm are counted. The minimum
curvature method combined with peak detection is
combined. The method can be effectively counts
of different types of paper, wherein, before the
correction accuracy is not reached 99.9%, after
subsequent counting error rate after correction is
less than 0.01%.
4. CONCLUSION
Aiming at the problem of stacking paper detection
and counting, this paper proposes a method of
detecting and counting laminated paper using the
combination of minimum curvature method and
peak detection. The basic principle is to first obtain
the gray cross-section of the stacked paper, pre-
process and calculate the curvature; then detect
the center point of the paper, and then correct the
detected center point by judging the spacing and
gray value between the adjacent two center points.
Thereby the ridge line results of the stacked paper
are obtained, and finally the peak detection is used
to count the ridge line results. Experiments show
that the algorithm of this paper can significantly
reduce the situation of multiple inspection and
missed detection of paper, can count many
different types of paper, and has high accuracy.
The algorithm in this paper has been applied to
paper testing instruments.
REFERENCES
[1]. Hui, Jiang Jin (2015), Study on paper counting
based on texture segmentation. pp.135-148.
[2]. Wang Xinxin, Xu Jiangwei, Zou Weijin, Liu
Yongfeng, Wang Xiuli (2014), Study on TFT-LCD
defect detection system[J], Journal of Electronic
Measurement and Instrument, pp. 278-284.
[3]. Wu C Z, Wang Y N (2015), Research on foreign
insoluble particulate detection method for medicinal
solution based on machine vision[J], Chinese
Journal of Scientific Instrument, 2015,36(7):1451-
1461.
[4]. Hou Weiyan,Zhang Liwei et al (2015), Design and
implementation of a bar counting measurement
system based on image processing[J], Chinese
Journal of Scientific Instrument, 2013, 34 (5):1100-
1106.
[5]. Petker Denis, Demold(de), et al. (2014), Method
and system for touchless counting of stac-ked
substrates, especially bundled banknotes [P],
United States: US20140147029A1, 20
[6]. Harba Rachid. Ferte La, Saint Aubin (fr) et al,
(2010). Card-counting device[P], United States:
US 2010/0226576A1.
[7]. Wang Fuzhi,Huang Dagui (2009), A paper grain
segmentation algorithm based on peak-valley
morphology[J], Journal of Electronic Measurement
and Instrument, 2009, 23(6): 103-107.
[8]. ZHENG Guang, CHEN You-ping, YU Wen-
yong, AI Wu (2007), Study on Paper Counting
Algorithm Based on Mathematical Morphology [J],
Microcomputer Information, 2007, 23(21): 214-215,
261.
[9]. Yang Shuo, Peng Shuang, Xiao Changyan (2015),
Fast linear growth algorithm for image analysis
and counting of laminated papers[J], Computer
Applications & Software, 2015,32(9): 188-191.
[10]. Dai Wei,Xiao Changyan (2016), Detection of
laminated paper quantity based on image frequency
domain analysis and correlation measurement[J],
Journal of Image and Graphics,2016,21(12): 1644-
1651.
[11]. Chen Xuwen, Liu Guixiong, Huang Jian (2015),
Image acquisition and surface curvature
elimination method for FPC[J], Journal of Electronic
Measurement and Instrument, 2015, 29 (6): 895-
900.
28
NGHIÊN CỨU KHOA HỌC
Tạp chí Nghiên cứu khoa học - Đại học Sao Đỏ, ISSN 1859-4190 Số 1(64).2019
Pham Thi Dieu Thuy
- Pham Thi Dieu Thuy received the B.S. degree in automation from Thai Nguyen University
of technology, Thai Nguyen, Vietnam, in 2006 and the M.S. degree in Measurement and
Control systems from Ha Noi University of Science and Technology, Ha Noi, Vietnam, in
2010. Her current research interests include medical image processing, machine vision
and machine learning.
- Email: dieuthuy303@gmail.com
- Telephone No: 0986468005
Ha Minh Tuan
- Ha Minh Tuan received the B.S degree in automation from Vietnam Maritime University,
Hai Phong, Vietnam, in 2005 and the M.S. degree in Measurement and Control systems
from Ha Noi University of Science and Technology, Ha Noi, Vietnam, in 2010. His current
research interests include medical image processing, machine vision and machine
learning.
- Email: minhtuanha031@gmail.com
THÔNG TIN VỀ TÁC GIẢ
[12]. Tao Q, Liu L (2016), Double regional evolution
based on level set for image segmentation[J],
Electronic Measurement Technology, 2016, 39 (9):
91-95.
[13]. Zhang M Y, Chen Z Y, Wang X (2013), Paper
counting algorithm based on image texture[J],
Optical Technique, 2013, 39(2): 151-156.
[14]. Chao Yang, Zengyou He and Weichuan Yu (2009),
Comparison of public peak detection algorithms for
MALDI mass spectrometry data analysis[J], BMC
bioinformatics, 2009, 10(1): 4.
[15]. ZHANG Z M, LIANG Y Z, et al (2012), Multiscale
peak alignment for chromatographic data
sets[J], Journal of chromatography A, 2012,
12(23): 93-106.
Nguyen Thi Viet Huong
- Nguyen Thi Viet Huong received the B.S. degree in Electrical Engineering Technology
from Hung Yen University of Technology and Education, Vietnam, in 2009 and the M.S.
degree in Control Engineering and Automation from Hung Yen University of Technology and
Education,Vietnam, in 2014. Her current research interests include Control Engineering
and Automation. Summary of current work: Lecturer, Faculty of Electrical Engineering,
Sao Do University.
- Email: nguyenthiviethuong1986@gmail.com
- Telephone No: 0989505045
Pham Thi Thao
- Pham Thi Thao received the B.S. degree in Electrification and power supply of enterprises
from Thai Nguyen university of Technology, Thai Nguyen, in 2002 and the M.S. degree in
Automation from Ha Noi University of Science and Technology, Ha Noi, Vietnam, in 2004.
Her current research interests include Control Engineering and Automation. Summary of
current work: Lecturer, Faculty of Electrical Engineering, Sao Do University.
- Email: phamhathao@gmail.com
- Telephone No: 0905006188
29
LIÊN NGÀNH ĐIỆN - ĐIỆN TỬ - TỰ ĐỘNG HÓA
Tạp chí Nghiên cứu khoa học - Đại học Sao Đỏ, ISSN 1859-4190 Số 1(64).2019
Luong Thi Thanh Xuan
- Luong Thi Thanh Xuan received the B.S. degree in Technology Education from Thai
Nguyen University of Technology, Thai Nguyen, in 2003 and the M.S. degree in Automation
from Thai Nguyen University of Technology, Thai Nguyen, Vietnam, in 2011. Her current
research interests include Control Engineering and Automation. Summary of current work:
Lecturer, Faculty of Electrical Engineering, Sao Do University.
- Email: thanhxuan7980@gmail.com
- Telephone No: 0982791980
File đính kèm:
 phuong_phap_dem_giay_xep_chong_dua_tren_su_ket_hop_do_cong_c.pdf

