Phương pháp đếm giấy dựa vào giá trị chênh lệch mức xám
In the manufacturing field of sheet products, such as paper, cigarette package, packing box, printed
circuit board (PCB), solar silicon chip and so on, the detection of laminated sheet is an essential part.
The precision of the counting directly affects the economic benefit of the factory and the subsequent
production operation. In order to reduce the high cost and noise in mechanical paper counters, paper
counting algorithms based on the gray value difference of paper have been applied and tested to
solve these problems based only on vision signals. After the images graying of neatly arranged, with
improvements to the greyscale edge of the Gabor filter, the gray pixel curve is obtained by using grayscale
differences after projecting the gray level. Based on the interval of the peaks as the location of the peak
or valley can be accurately positioned after removing the peak valley disturbances. The paper count is
then made according to the location marker. Counting results show that this method of counting paper
can be done with simple operation, while the accurate paper counting rate reaches more than 98%.
Trang 1
Trang 2
Trang 3
Trang 4
Trang 5
Trang 6
Trang 7
Tóm tắt nội dung tài liệu: Phương pháp đếm giấy dựa vào giá trị chênh lệch mức xám
perform edge
enhancement on gratscale images
The calculation of the grayscale
value are made according to the line
gray curves
Set the binarization threshold,
Change the difference gray into
rectangular image
Determine the number of sheets
based on the number of rectangular
image output the result
8NGHIÊN CỨU KHOA HỌC
Tạp chí Nghiên cứu khoa học,Trường Đại học Sao Đỏ, ISSN 1859-4190 Số 4 (67).2019
pattern recognition, and computer vision. Since
the 1990s, researchers have conducted in-depth
research on the application of Gabor filters in
texture segmentation, object detection, image
enhancement, and image feature extraction. The
commonly used even-symmetric two-dimensional
Gabor filter can be expressed as:
 (2)
 (3)
Where:
θ is the direction of the Gabor filter;
σu and σv are the standard deviations of the Gaussian envelope on the u-axis and the v-axis
(u-axis is parallel to θ, v-axis is straight to θ), and
ω is the modulation frequency.
First, a Gabor filter template with different spatial
frequencies of 5 × 5 is designed. Since the Gabor
function is a Gaussian function modulated by a
complex sine function, when filtering the paper,
the real part of the filter is used to filter the paper.
Define the image for filtered by the Gabor filter as
 (4)
In the formula: i (x, y) is the input grayscale image,
* represents the convolution operation.
3.3. Gray projection
Gray projection includes row projection and column
projection. Row projection is obtained by adding
the gray values of each point in each row in the
image. Column projection is obtained by adding
the gray values of each point in each column in
the image. The projection value of each row or
column is described in a rectangular coordinate
system, and a gray-scale projection curve is
obtained. The gray-scale projection curve can be
used to intuitively see the distribution of gray-scale
information in the image. There is a noticeable
difference in the stripe gray level of paper, so it
can be used as a method of counting paper. In this
study, in order to reduce the amount of calculation
and keep the pixel value between 0 ~ 255, the
average value of the gray value of each column of
pixels was used for calculation.
In the formula: row (i) represents the sum of pixels
in i-th row of the image, and col (j) represents the
sum of pixels in the j-th column of the image.
3.4. Gray difference calculation
Perform gray-level difference calculation on
the gray-scale projected image, that is, the sum
of the gray values of the projected image in the
projection area is calculated as a one-dimensional
vectơ, and the starting value of the statistical
gray-value vectơ is set to 0, and the subtraction
operation is performed on the grayscale values in
the order of backward difference in order to obtain
another one-dimensional vectơ, and the value of
this vectơ is the result obtained by the difference
of the grayscale values. In this paper, the results
obtained after graying the original image and
projecting the difference are shown in Fig. 3.
It can be seen from Fig.3 that the above-mentioned
method for performing differential operation on
gray values has a wave shape trajectory locally,
which corresponds to the light and dark stripes
of the paper in Fig. 1. It can be seen that when
the corresponding gray value at the edge of the
paper is small and the corresponding gray value is
large at the gap between the two papers, the wave
trough in the curve obtained after the differential
calculation of the image corresponds to the two
papers and the peaks correspond to the paper,
so the peaks and valleys will appear periodically
in the curve after the differential calculation of the
image. The gray difference between the adjacent
peaks and valleys corresponds to the white stripes
to black in the image. Stripe jump, this jump can be
considered as the dividing line between two sheets
of paper. Then, based on this characteristic, an
algorithm can be designed to calculate the number
of sheets.
3.5. Paper counting algorithm
The paper counting algorithm works as follow:
1) In the effect map obtained by differentiating
the gray projection curve, find all the peaks and
troughs in the curve, then find the length of the
interval between two adjacent peaks or troughs,
the last all the peak-to-peak intervals or valley
intervals are counted.
2) Perform a binarization operation according to
the difference projection map, the specific method
is: if the value of the gray value at a certain point
changes from less than 0 to greater than 0, it is
assumed that there is 1 sheet of paper here, the
transition points greater than 0 are marked with
red rectangles in the original image.
3) From the first point of the peak or trough,
determine whether it is within the range of [len-wid,
len + wid], where wid is a constant that is customized
to reduce the counting error. In this study, wid = 3.
If it is within this range, the next judgment is made;
otherwise, the point is discarded.
h(x, y) = !"#$!$" exp *− !" ,%#$!# + &#$"#./ cos(ωu) u = xcosθ + ysinθ, v = −xcosθ + y sin θ°
f° = |i(x, y)∗h(x, y)|°
 (5)
 (6)
row(i) = (img(i, j)!"#$
 col(j) = (img(i, j)°&'#$
9LIÊN NGÀNH ĐIỆN - ĐIỆN TỬ - TỰ ĐỘNG HÓA
Tạp chí Nghiên cứu khoa học, Trường Đại học Sao Đỏ, ISSN 1859-4190 Số 4 (67).2019
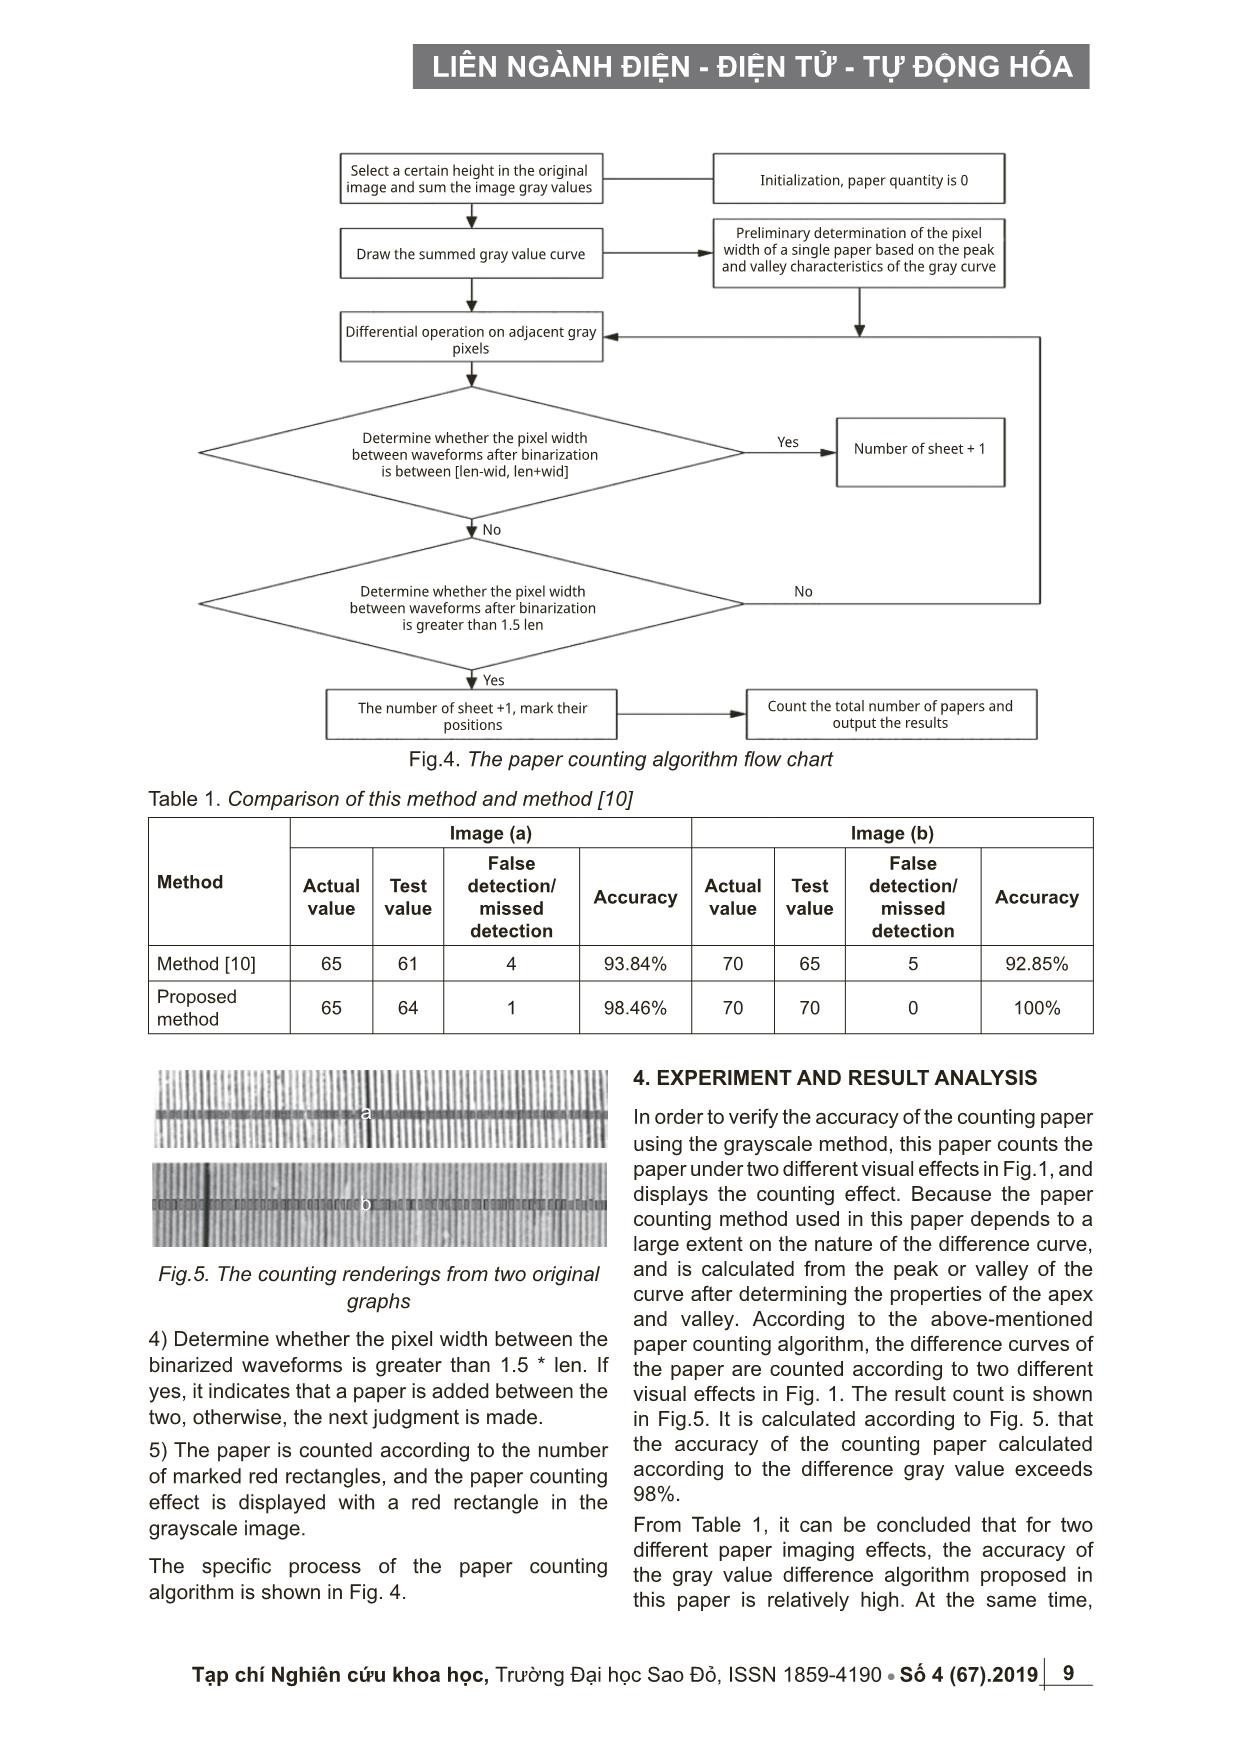
Fig.4. The paper counting algorithm flow chart
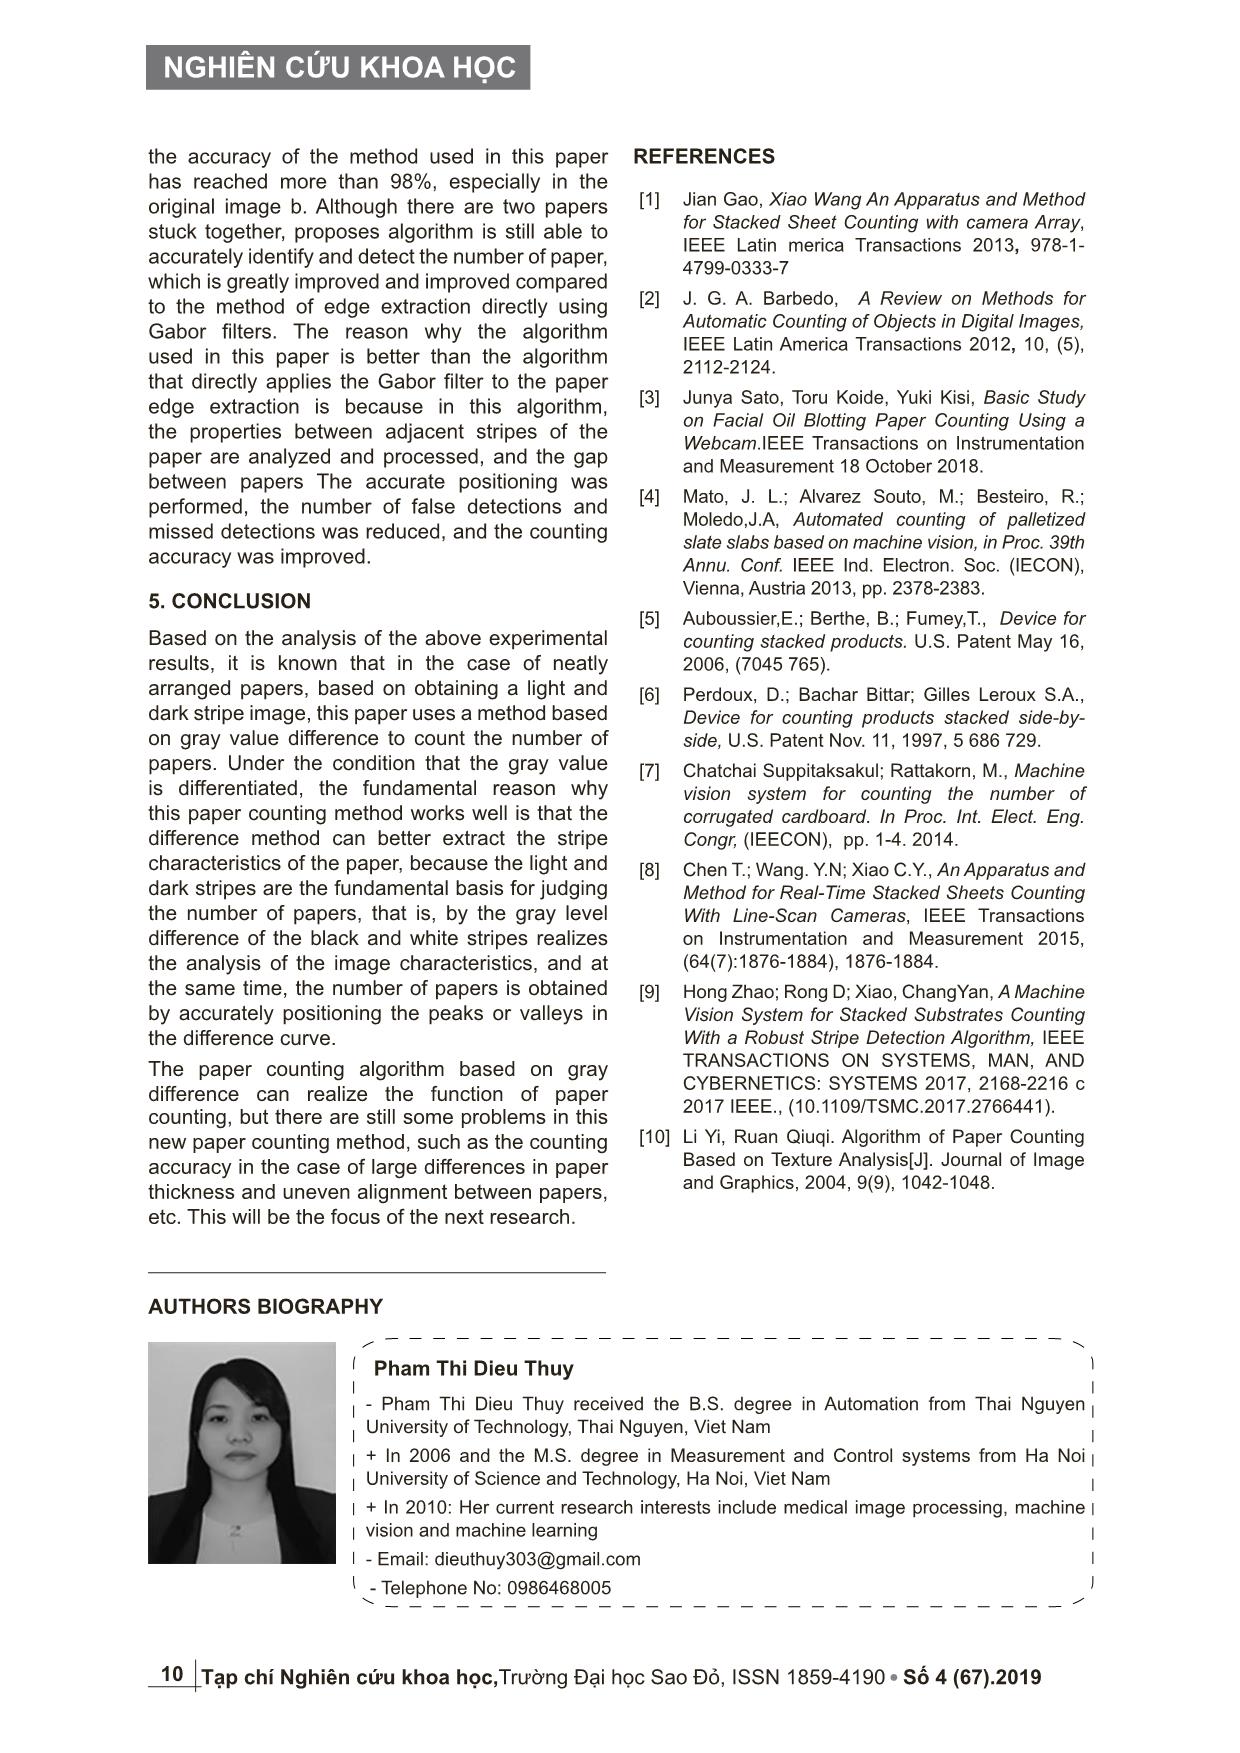
Table 1. Comparison of this method and method [10]
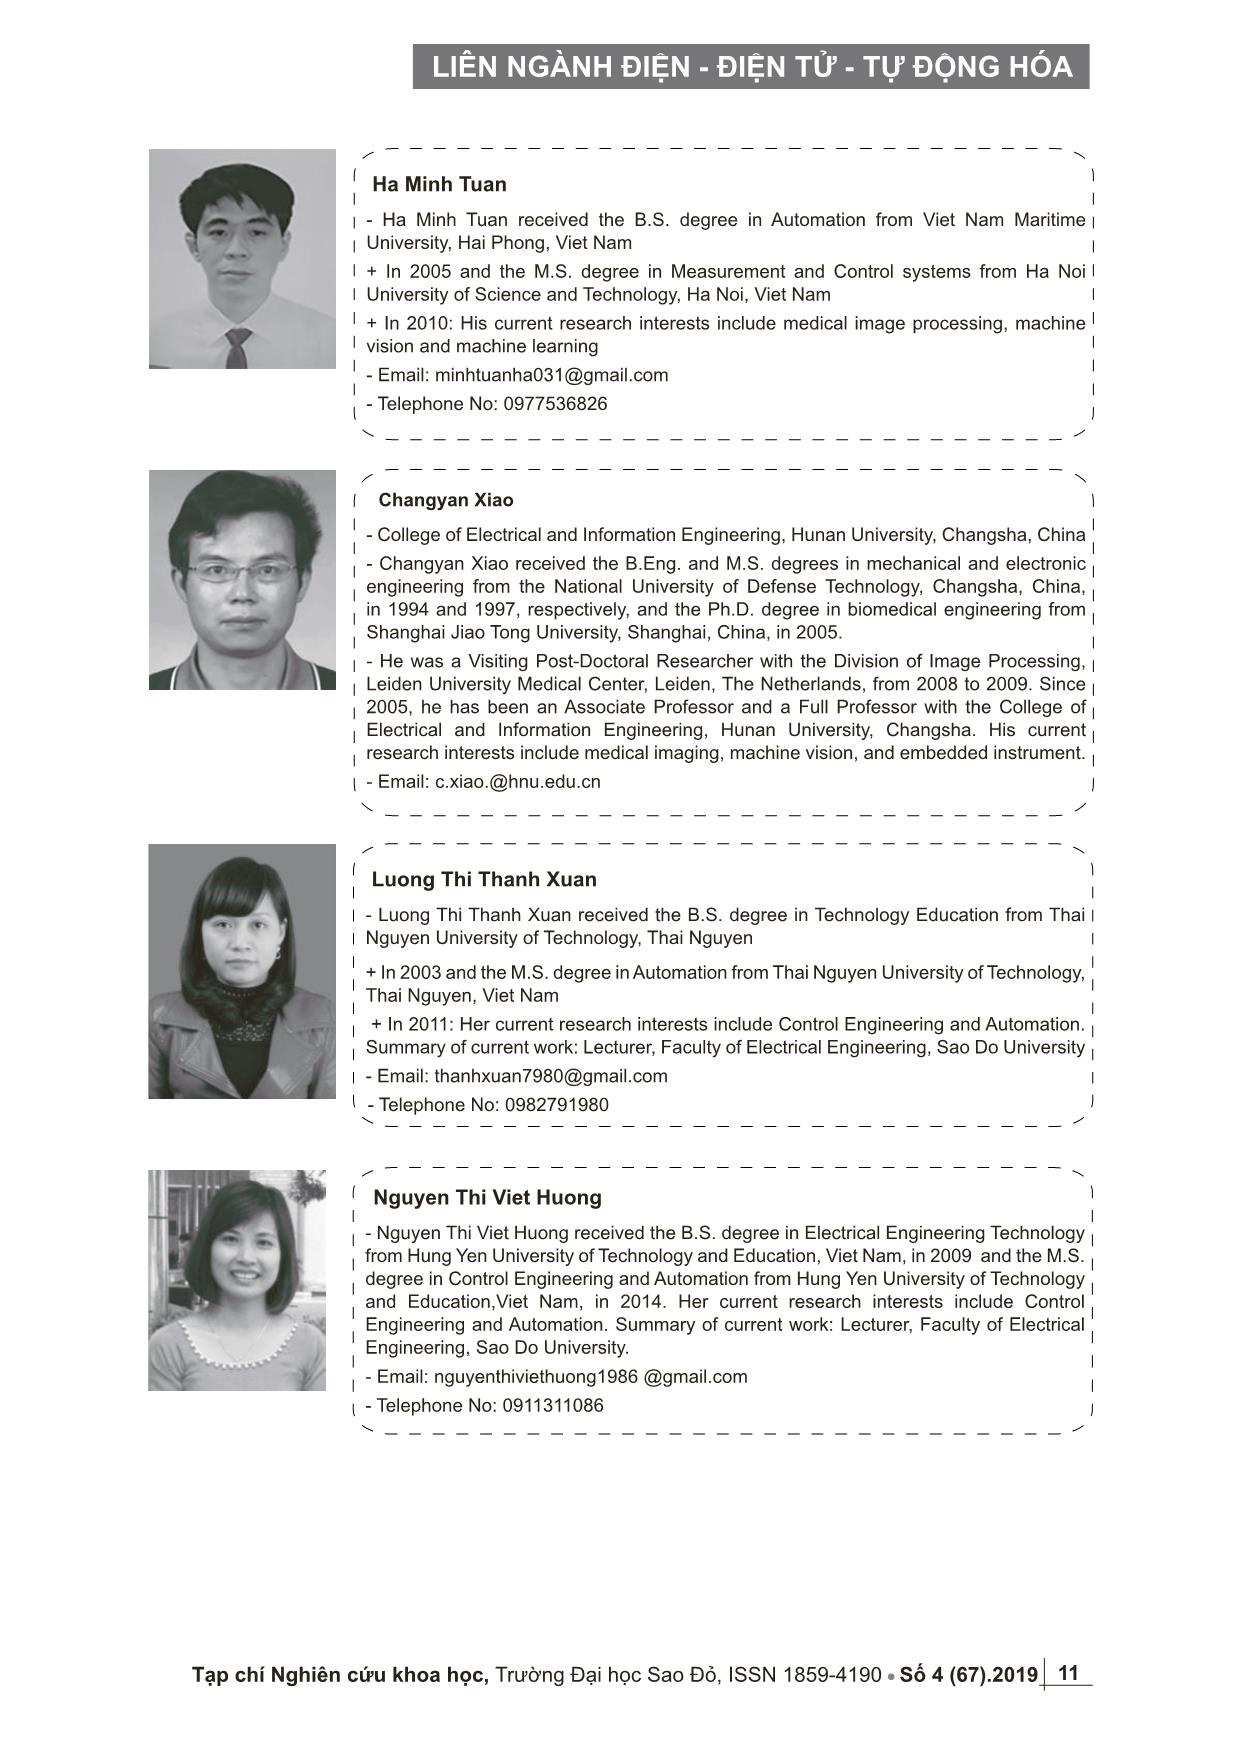
a
b
Fig.5. The counting renderings from two original
graphs
4) Determine whether the pixel width between the
binarized waveforms is greater than 1.5 * len. If
yes, it indicates that a paper is added between the
two, otherwise, the next judgment is made.
5) The paper is counted according to the number
of marked red rectangles, and the paper counting
effect is displayed with a red rectangle in the
grayscale image.
The specific process of the paper counting
algorithm is shown in Fig. 4.
4. EXPERIMENT AND RESULT ANALYSIS
In order to verify the accuracy of the counting paper
using the grayscale method, this paper counts the
paper under two different visual effects in Fig.1, and
displays the counting effect. Because the paper
counting method used in this paper depends to a
large extent on the nature of the difference curve,
and is calculated from the peak or valley of the
curve after determining the properties of the apex
and valley. According to the above-mentioned
paper counting algorithm, the difference curves of
the paper are counted according to two different
visual effects in Fig. 1. The result count is shown
in Fig.5. It is calculated according to Fig. 5. that
the accuracy of the counting paper calculated
according to the difference gray value exceeds
98%.
From Table 1, it can be concluded that for two
different paper imaging effects, the accuracy of
the gray value difference algorithm proposed in
this paper is relatively high. At the same time,
Method
Image (a) Image (b)
Actual
value
Test
value
False
detection/
missed
detection
Accuracy Actual value
Test
value
False
detection/
missed
detection
Accuracy
Method [10] 65 61 4 93.84% 70 65 5 92.85%
Proposed
method 65 64 1 98.46% 70 70 0 100%
Select a certain height in the original
image and sum the image gray values Initialization, paper quantity is 0
Draw the summed gray value curve
Differential operation on adjacent gray
pixels
Preliminary determination of the pixel
width of a single paper based on the peak
and valley characteristics of the gray curve
Determine whether the pixel width
between waveforms after binarization
is between [len-wid, len+wid]
Yes
Yes
Number of sheet + 1
Determine whether the pixel width
between waveforms after binarization
is greater than 1.5 len
No
No
The number of sheet +1, mark their
positions
Count the total number of papers and
output the results
10
NGHIÊN CỨU KHOA HỌC
Tạp chí Nghiên cứu khoa học,Trường Đại học Sao Đỏ, ISSN 1859-4190 Số 4 (67).2019
the accuracy of the method used in this paper
has reached more than 98%, especially in the
original image b. Although there are two papers
stuck together, proposes algorithm is still able to
accurately identify and detect the number of paper,
which is greatly improved and improved compared
to the method of edge extraction directly using
Gabor filters. The reason why the algorithm
used in this paper is better than the algorithm
that directly applies the Gabor filter to the paper
edge extraction is because in this algorithm,
the properties between adjacent stripes of the
paper are analyzed and processed, and the gap
between papers The accurate positioning was
performed, the number of false detections and
missed detections was reduced, and the counting
accuracy was improved.
5. CONCLUSION
Based on the analysis of the above experimental
results, it is known that in the case of neatly
arranged papers, based on obtaining a light and
dark stripe image, this paper uses a method based
on gray value difference to count the number of
papers. Under the condition that the gray value
is differentiated, the fundamental reason why
this paper counting method works well is that the
difference method can better extract the stripe
characteristics of the paper, because the light and
dark stripes are the fundamental basis for judging
the number of papers, that is, by the gray level
difference of the black and white stripes realizes
the analysis of the image characteristics, and at
the same time, the number of papers is obtained
by accurately positioning the peaks or valleys in
the difference curve.
The paper counting algorithm based on gray
difference can realize the function of paper
counting, but there are still some problems in this
new paper counting method, such as the counting
accuracy in the case of large differences in paper
thickness and uneven alignment between papers,
etc. This will be the focus of the next research.
REFERENCES
[1] Jian Gao, Xiao Wang An Apparatus and Method
for Stacked Sheet Counting with camera Array,
IEEE Latin merica Transactions 2013, 978-1-
4799-0333-7
[2] J. G. A. Barbedo, A Review on Methods for
Automatic Counting of Objects in Digital Images,
IEEE Latin America Transactions 2012, 10, (5),
2112-2124.
[3] Junya Sato, Toru Koide, Yuki Kisi, Basic Study
on Facial Oil Blotting Paper Counting Using a
Webcam.IEEE Transactions on Instrumentation
and Measurement 18 October 2018.
[4] Mato, J. L.; Alvarez Souto, M.; Besteiro, R.;
Moledo,J.A, Automated counting of palletized
slate slabs based on machine vision, in Proc. 39th
Annu. Conf. IEEE Ind. Electron. Soc. (IECON),
Vienna, Austria 2013, pp. 2378-2383.
[5] Auboussier,E.; Berthe, B.; Fumey,T., Device for
counting stacked products. U.S. Patent May 16,
2006, (7045 765).
[6] Perdoux, D.; Bachar Bittar; Gilles Leroux S.A.,
Device for counting products stacked side-by-
side, U.S. Patent Nov. 11, 1997, 5 686 729.
[7] Chatchai Suppitaksakul; Rattakorn, M., Machine
vision system for counting the number of
corrugated cardboard. In Proc. Int. Elect. Eng.
Congr, (IEECON), pp. 1-4. 2014.
[8] Chen T.; Wang. Y.N; Xiao C.Y., An Apparatus and
Method for Real-Time Stacked Sheets Counting
With Line-Scan Cameras, IEEE Transactions
on Instrumentation and Measurement 2015,
(64(7):1876-1884), 1876-1884.
[9] Hong Zhao; Rong D; Xiao, ChangYan, A Machine
Vision System for Stacked Substrates Counting
With a Robust Stripe Detection Algorithm, IEEE
TRANSACTIONS ON SYSTEMS, MAN, AND
CYBERNETICS: SYSTEMS 2017, 2168-2216 c
2017 IEEE., (10.1109/TSMC.2017.2766441).
[10] Li Yi, Ruan Qiuqi. Algorithm of Paper Counting
Based on Texture Analysis[J]. Journal of Image
and Graphics, 2004, 9(9), 1042-1048.
Pham Thi Dieu Thuy
- Pham Thi Dieu Thuy received the B.S. degree in Automation from Thai Nguyen
University of Technology, Thai Nguyen, Viet Nam
+ In 2006 and the M.S. degree in Measurement and Control systems from Ha Noi
University of Science and Technology, Ha Noi, Viet Nam
+ In 2010: Her current research interests include medical image processing, machine
vision and machine learning
- Email: dieuthuy303@gmail.com
- Telephone No: 0986468005
AUTHORS BIOGRAPHY
11
LIÊN NGÀNH ĐIỆN - ĐIỆN TỬ - TỰ ĐỘNG HÓA
Tạp chí Nghiên cứu khoa học, Trường Đại học Sao Đỏ, ISSN 1859-4190 Số 4 (67).2019
Ha Minh Tuan
- Ha Minh Tuan received the B.S. degree in Automation from Viet Nam Maritime
University, Hai Phong, Viet Nam
+ In 2005 and the M.S. degree in Measurement and Control systems from Ha Noi
University of Science and Technology, Ha Noi, Viet Nam
+ In 2010: His current research interests include medical image processing, machine
vision and machine learning
- Email: minhtuanha031@gmail.com
- Telephone No: 0977536826
Luong Thi Thanh Xuan
- Luong Thi Thanh Xuan received the B.S. degree in Technology Education from Thai
Nguyen University of Technology, Thai Nguyen
+ In 2003 and the M.S. degree in Automation from Thai Nguyen University of Technology,
Thai Nguyen, Viet Nam
 + In 2011: Her current research interests include Control Engineering and Automation.
Summary of current work: Lecturer, Faculty of Electrical Engineering, Sao Do University
- Email: thanhxuan7980@gmail.com
- Telephone No: 0982791980
Changyan Xiao
- College of Electrical and Information Engineering, Hunan University, Changsha, China
- Changyan Xiao received the B.Eng. and M.S. degrees in mechanical and electronic
engineering from the National University of Defense Technology, Changsha, China,
in 1994 and 1997, respectively, and the Ph.D. degree in biomedical engineering from
Shanghai Jiao Tong University, Shanghai, China, in 2005.
- He was a Visiting Post-Doctoral Researcher with the Division of Image Processing,
Leiden University Medical Center, Leiden, The Netherlands, from 2008 to 2009. Since
2005, he has been an Associate Professor and a Full Professor with the College of
Electrical and Information Engineering, Hunan University, Changsha. His current
research interests include medical imaging, machine vision, and embedded instrument.
- Email: c.xiao.@hnu.edu.cn
Nguyen Thi Viet Huong
- Nguyen Thi Viet Huong received the B.S. degree in Electrical Engineering Technology
from Hung Yen University of Technology and Education, Viet Nam, in 2009 and the M.S.
degree in Control Engineering and Automation from Hung Yen University of Technology
and Education,Viet Nam, in 2014. Her current research interests include Control
Engineering and Automation. Summary of current work: Lecturer, Faculty of Electrical
Engineering, Sao Do University.
- Email: nguyenthiviethuong1986 @gmail.com
- Telephone No: 0911311086
File đính kèm:
 phuong_phap_dem_giay_dua_vao_gia_tri_chenh_lech_muc_xam.pdf

