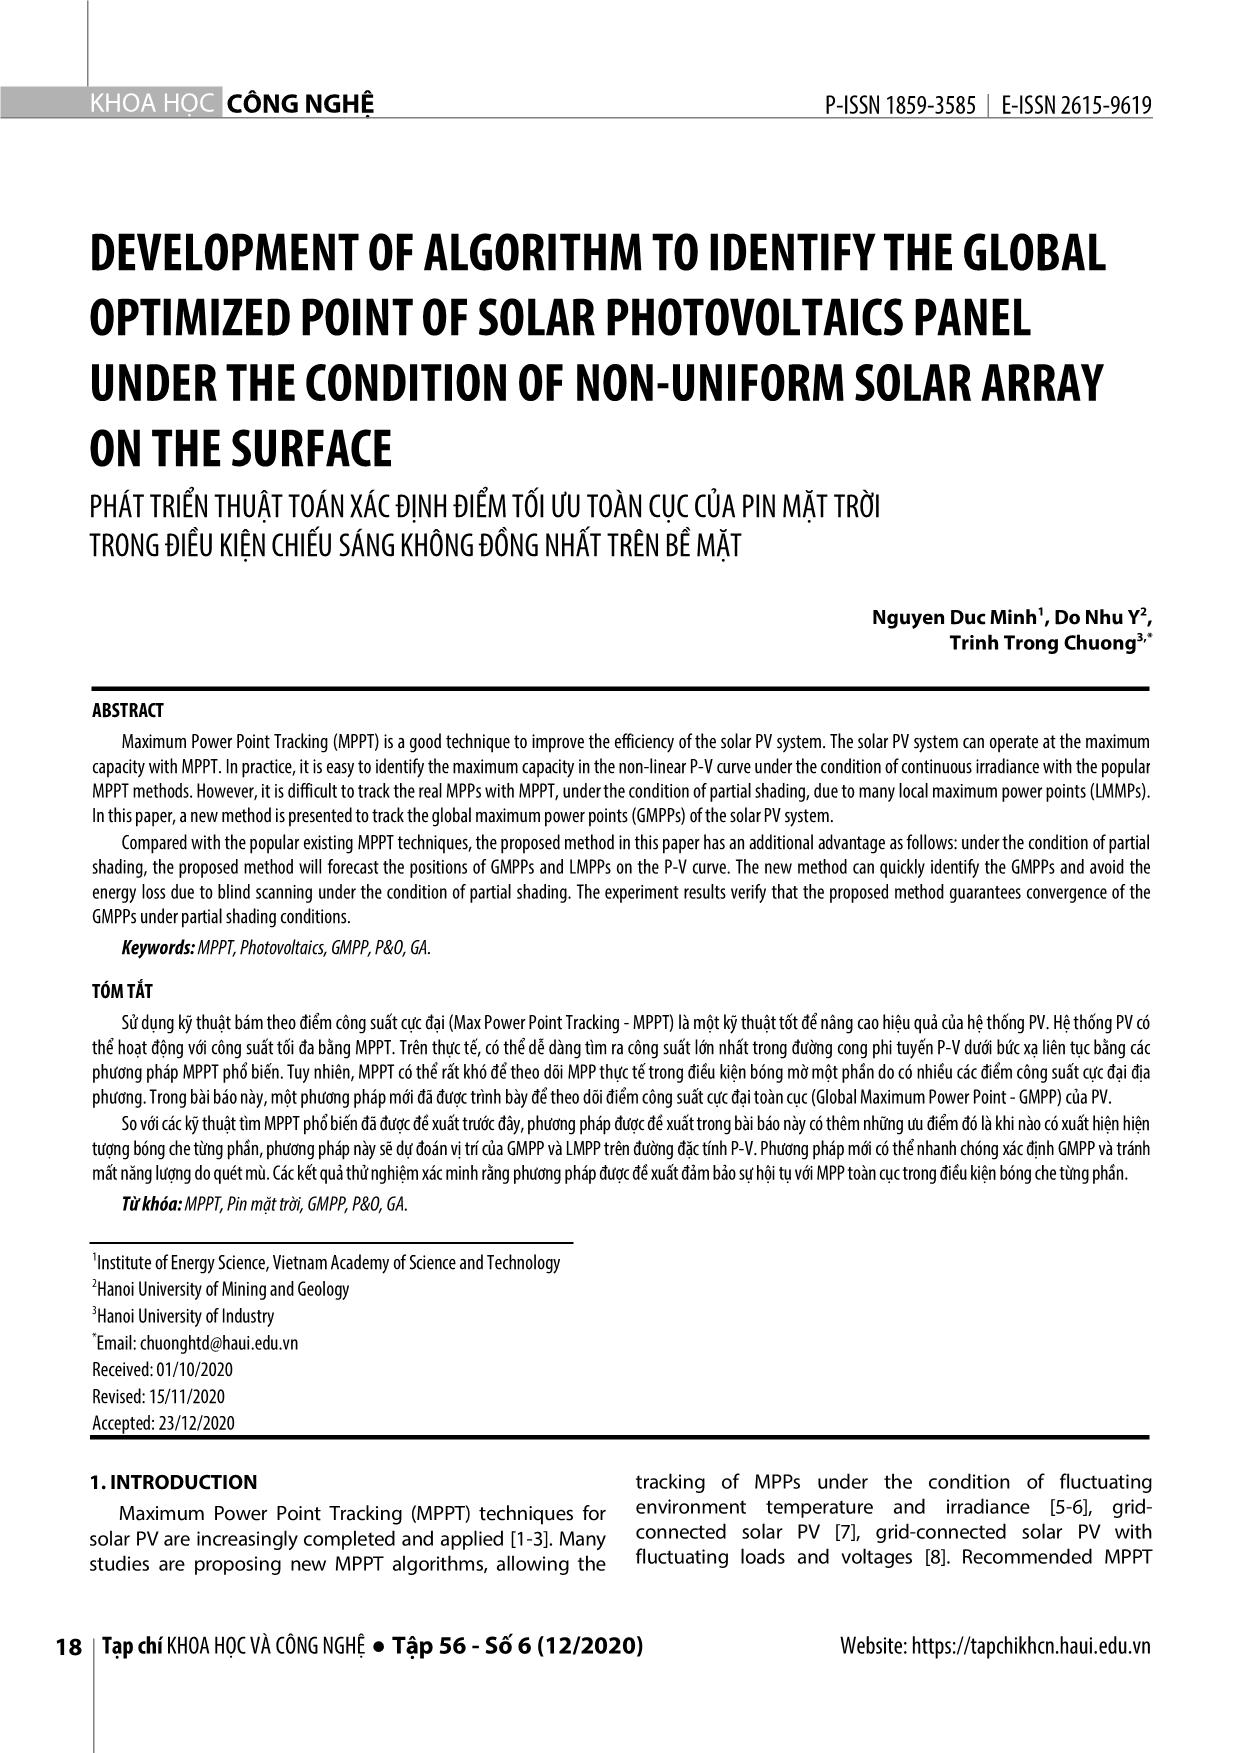
Phát triển thuật toán xác định điểm tối ưu toàn cục của pin mặt trời trong điều kiện chiếu sáng không đồng nhất trên bề mặt
Sử dụng kỹ thuật bám theo điểm công suất cực đại (Max Power Point Tracking - MPPT) là một kỹ thuật tốt để nâng cao hiệu quả của hệ thống PV. Hệ thống PV có
thể hoạt động với công suất tối đa bằng MPPT. Trên thực tế, có thể dễ dàng tìm ra công suất lớn nhất trong đường cong phi tuyến P-V dưới bức xạ liên tục bằng các
phương pháp MPPT phổ biến. Tuy nhiên, MPPT có thể rất khó để theo dõi MPP thực tế trong điều kiện bóng mờ một phần do có nhiều các điểm công suất cực đại địa
phương. Trong bài báo này, một phương pháp mới đã được trình bày để theo dõi điểm công suất cực đại toàn cục (Global Maximum Power Point - GMPP) của PV.
So với các kỹ thuật tìm MPPT phổ biến đã được đề xuất trước đây, phương pháp được đề xuất trong bài báo này có thêm những ưu điểm đó là khi nào có xuất hiện hiện
tượng bóng che từng phần, phương pháp này sẽ dự đoán vị trí của GMPP và LMPP trên đường đặc tính P-V. Phương pháp mới có thể nhanh chóng xác định GMPP và tránh
mất năng lượng do quét mù. Các kết quả thử nghiệm xác minh rằng phương pháp được đề xuất đảm bảo sự hội tụ với MPP toàn cục trong điều kiện bóng che từng phần.
Trang 1
Trang 2
Trang 3
Trang 4
Trang 5
Trang 6
Trang 7
Trang 8
Tóm tắt nội dung tài liệu: Phát triển thuật toán xác định điểm tối ưu toàn cục của pin mặt trời trong điều kiện chiếu sáng không đồng nhất trên bề mặt
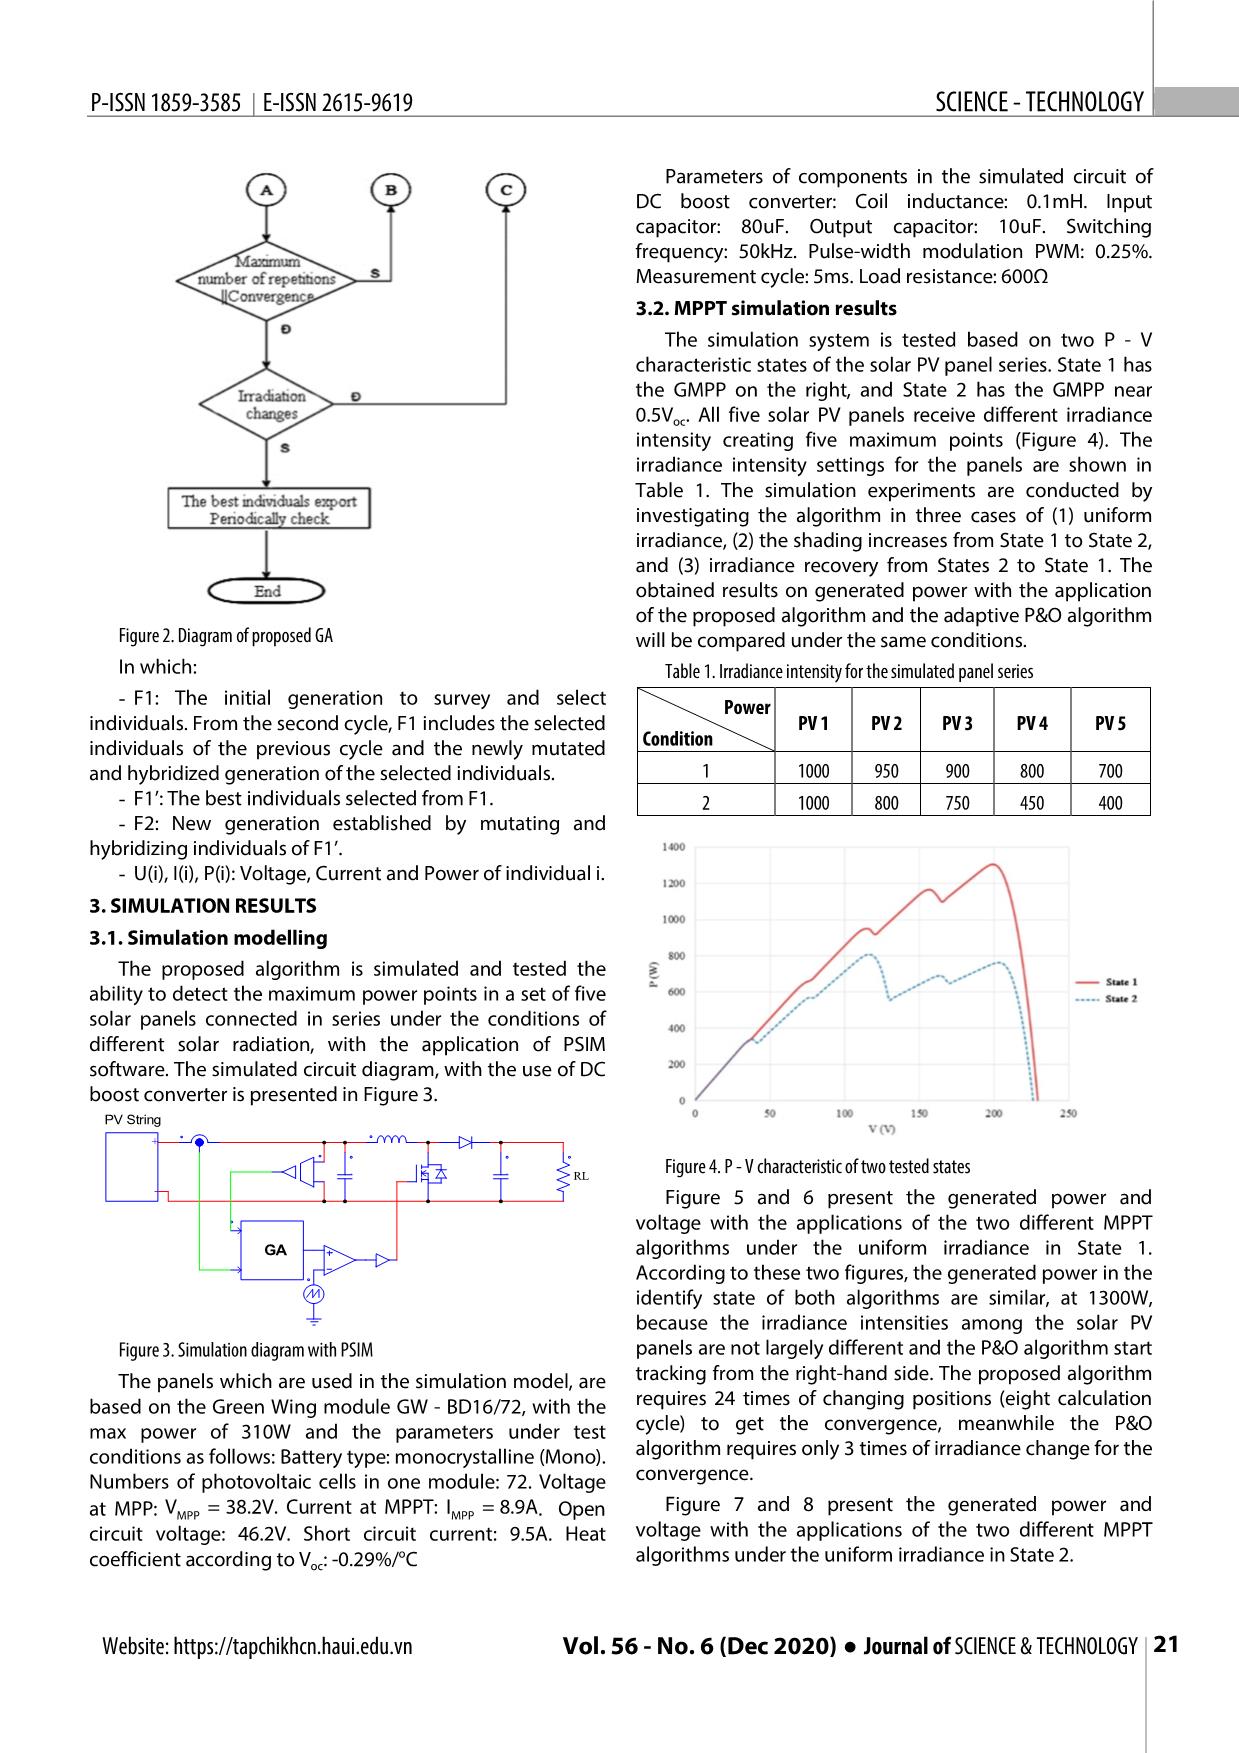
of DC
boost converter is presented in Figure 3.
 PV String
 +
 RL Figure 4. P - V characteristic of two tested states
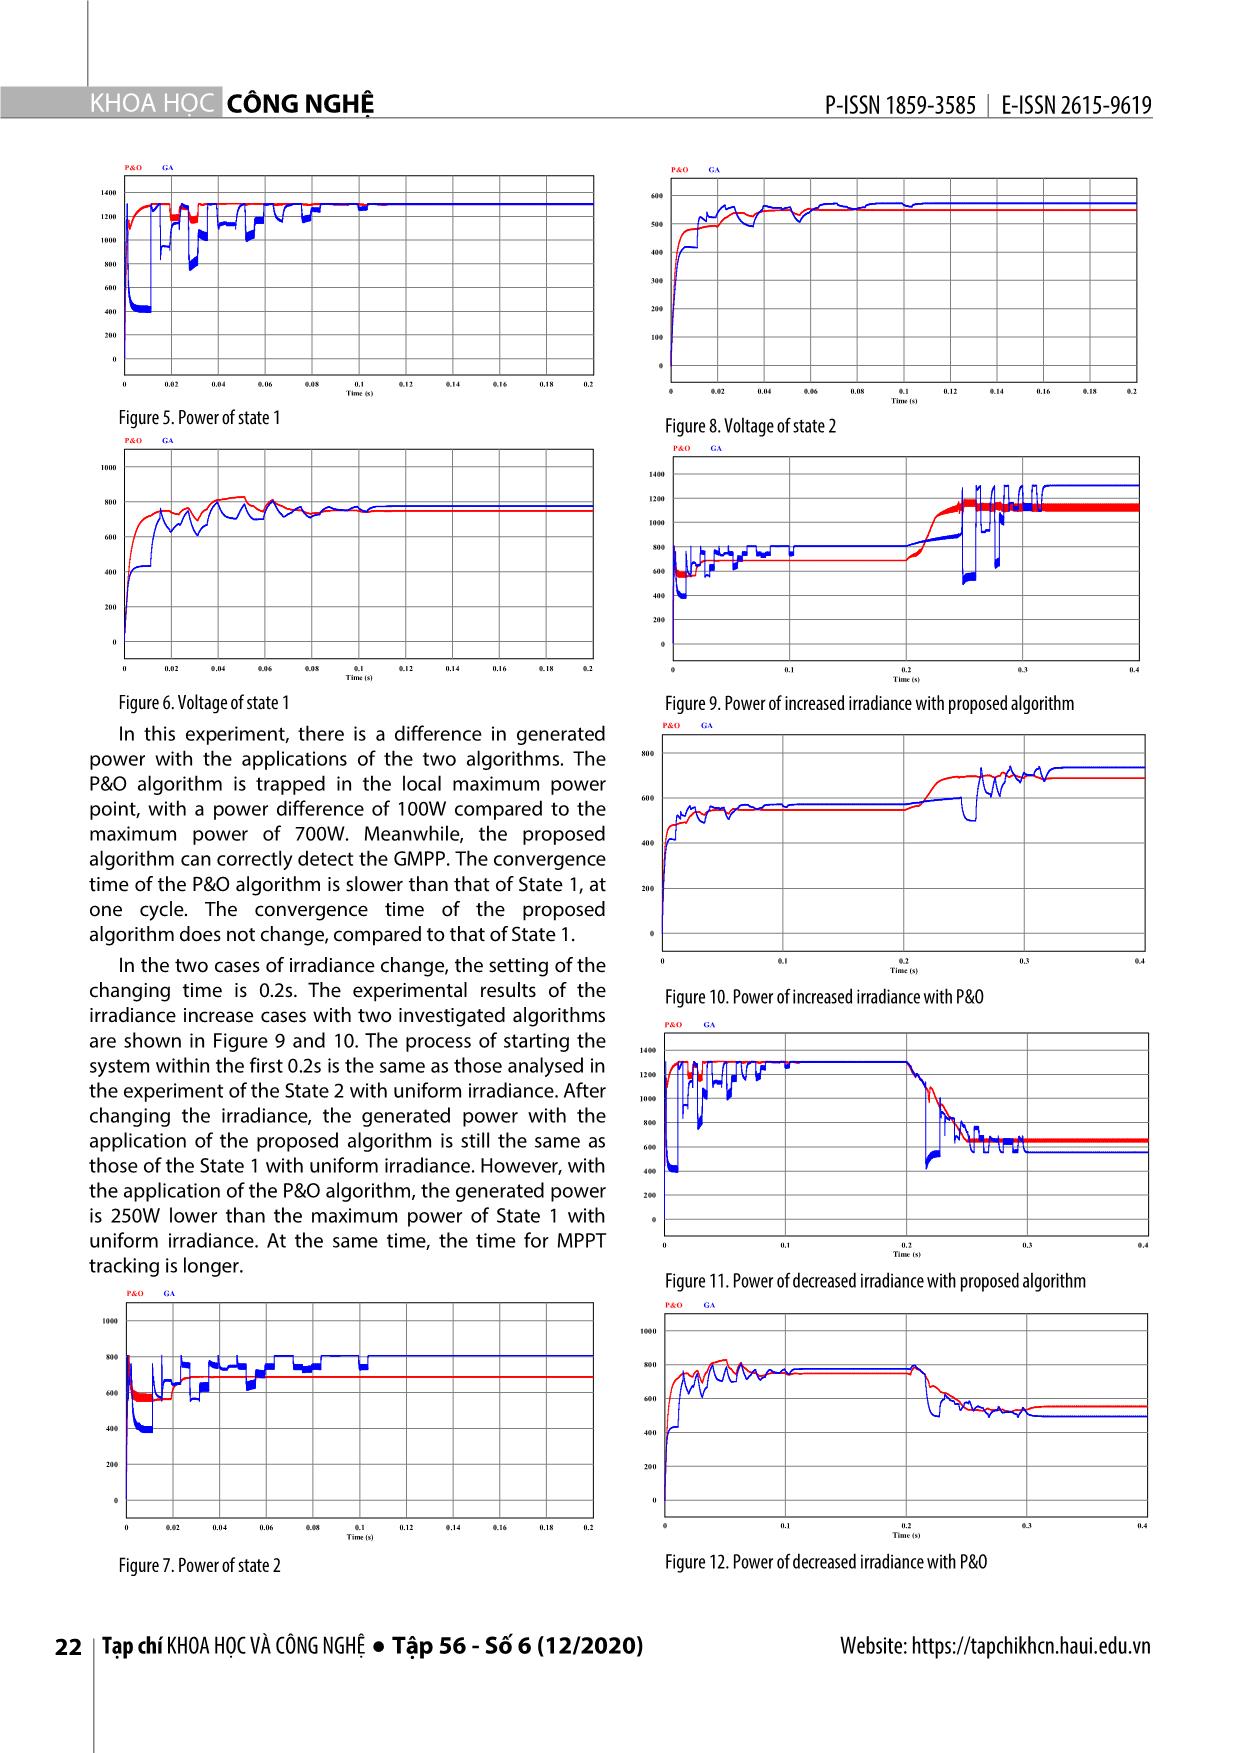
 - Figure 5 and 6 present the generated power and
 voltage with the applications of the two different MPPT
 GA algorithms under the uniform irradiance in State 1.
 According to these two figures, the generated power in the
 identify state of both algorithms are similar, at 1300W,
 because the irradiance intensities among the solar PV
 Figure 3. Simulation diagram with PSIM panels are not largely different and the P&O algorithm start
 The panels which are used in the simulation model, are tracking from the right-hand side. The proposed algorithm
based on the Green Wing module GW - BD16/72, with the requires 24 times of changing positions (eight calculation
max power of 310W and the parameters under test cycle) to get the convergence, meanwhile the P&O
conditions as follows: Battery type: monocrystalline (Mono). algorithm requires only 3 times of irradiance change for the
Numbers of photovoltaic cells in one module: 72. Voltage convergence.
 Figure 7 and 8 present the generated power and
at MPP: VMPP = 38.2V. Current at MPPT: IMPP = 8.9A. Open
circuit voltage: 46.2V. Short circuit current: 9.5A. Heat voltage with the applications of the two different MPPT
 o algorithms under the uniform irradiance in State 2.
coefficient according to Voc: -0.29%/ C
 Website: https://tapchikhcn.haui.edu.vn Vol. 56 - No. 6 (Dec 2020) ● Journal of SCIENCE & TECHNOLOGY 21
 KHOA H ỌC CÔNG NGHỆ P - ISSN 1859 - 3585 E - ISSN 2615 - 961 9
 P&O GA P&O GA
 1400 600
 1200
 500
 1000
 400
 800
 300
 600
 400 200
 200 100
 0
 0
 0 0.02 0.04 0.06 0.08 0.1 0.12 0.14 0.16 0.18 0.2
 Time (s) 0 0.02 0.04 0.06 0.08 0.1 0.12 0.14 0.16 0.18 0.2
 Time (s)
 Figure 5. Power of state 1 Figure 8. Voltage of state 2
 P&O GA
 P&O GA
 1000
 1400
 800 1200
 1000
 600
 800
 400 600
 400
 200
 200
 0 0
 0 0.02 0.04 0.06 0.08 0.1 0.12 0.14 0.16 0.18 0.2 0 0.1 0.2 0.3 0.4
 Time (s) Time (s)
 Figure 6. Voltage of state 1 Figure 9. Power of increased irradiance with proposed algorithm
 In this experiment, there is a difference in generated P&O GA
 power with the applications of the two algorithms. The 800
 P&O algorithm is trapped in the local maximum power
 600
 point, with a power difference of 100W compared to the
 maximum power of 700W. Meanwhile, the proposed 400
 algorithm can correctly detect the GMPP. The convergence
 time of the P&O algorithm is slower than that of State 1, at 200
 one cycle. The convergence time of the proposed
 algorithm does not change, compared to that of State 1. 0
 0 0.1 0.2 0.3 0.4
 In the two cases of irradiance change, the setting of the Time (s)
 changing time is 0.2s. The experimental results of the Figure 10. Power of increased irradiance with P&O
 irradiance increase cases with two investigated algorithms P&O GA
 are shown in Figure 9 and 10. The process of starting the 1400
 system within the first 0.2s is the same as those analysed in 1200
 the experiment of the State 2 with uniform irradiance. After 1000
 changing the irradiance, the generated power with the 800
 application of the proposed algorithm is still the same as 600
 those of the State 1 with uniform irradiance. However, with 400
 the application of the P&O algorithm, the generated power 200
 is 250W lower than the maximum power of State 1 with 0
 uniform irradiance. At the same time, the time for MPPT 0 0.1 0.2 0.3 0.4
 Time (s)
 tracking is longer.
 Figure 11. Power of decreased irradiance with proposed algorithm
 P&O GA
 P&O GA
 1000
 1000
 800
 800
 600
 600
 400
 400
 200 200
 0 0
 0 0.02 0.04 0.06 0.08 0.1 0.12 0.14 0.16 0.18 0.2 0 0.1 0.2 0.3 0.4
 Time (s) Time (s)
 Figure 7. Power of state 2 Figure 12. Power of decreased irradiance with P&O
22 Tạp chí KHOA HỌC VÀ CÔNG NGHỆ ● Tập 56 - Số 6 (12/2020) Website: https://tapchikhcn.haui.edu.vn
P-ISSN 1859-3585 E-ISSN 2615-9619 SCIENCE - TECHNOLOGY
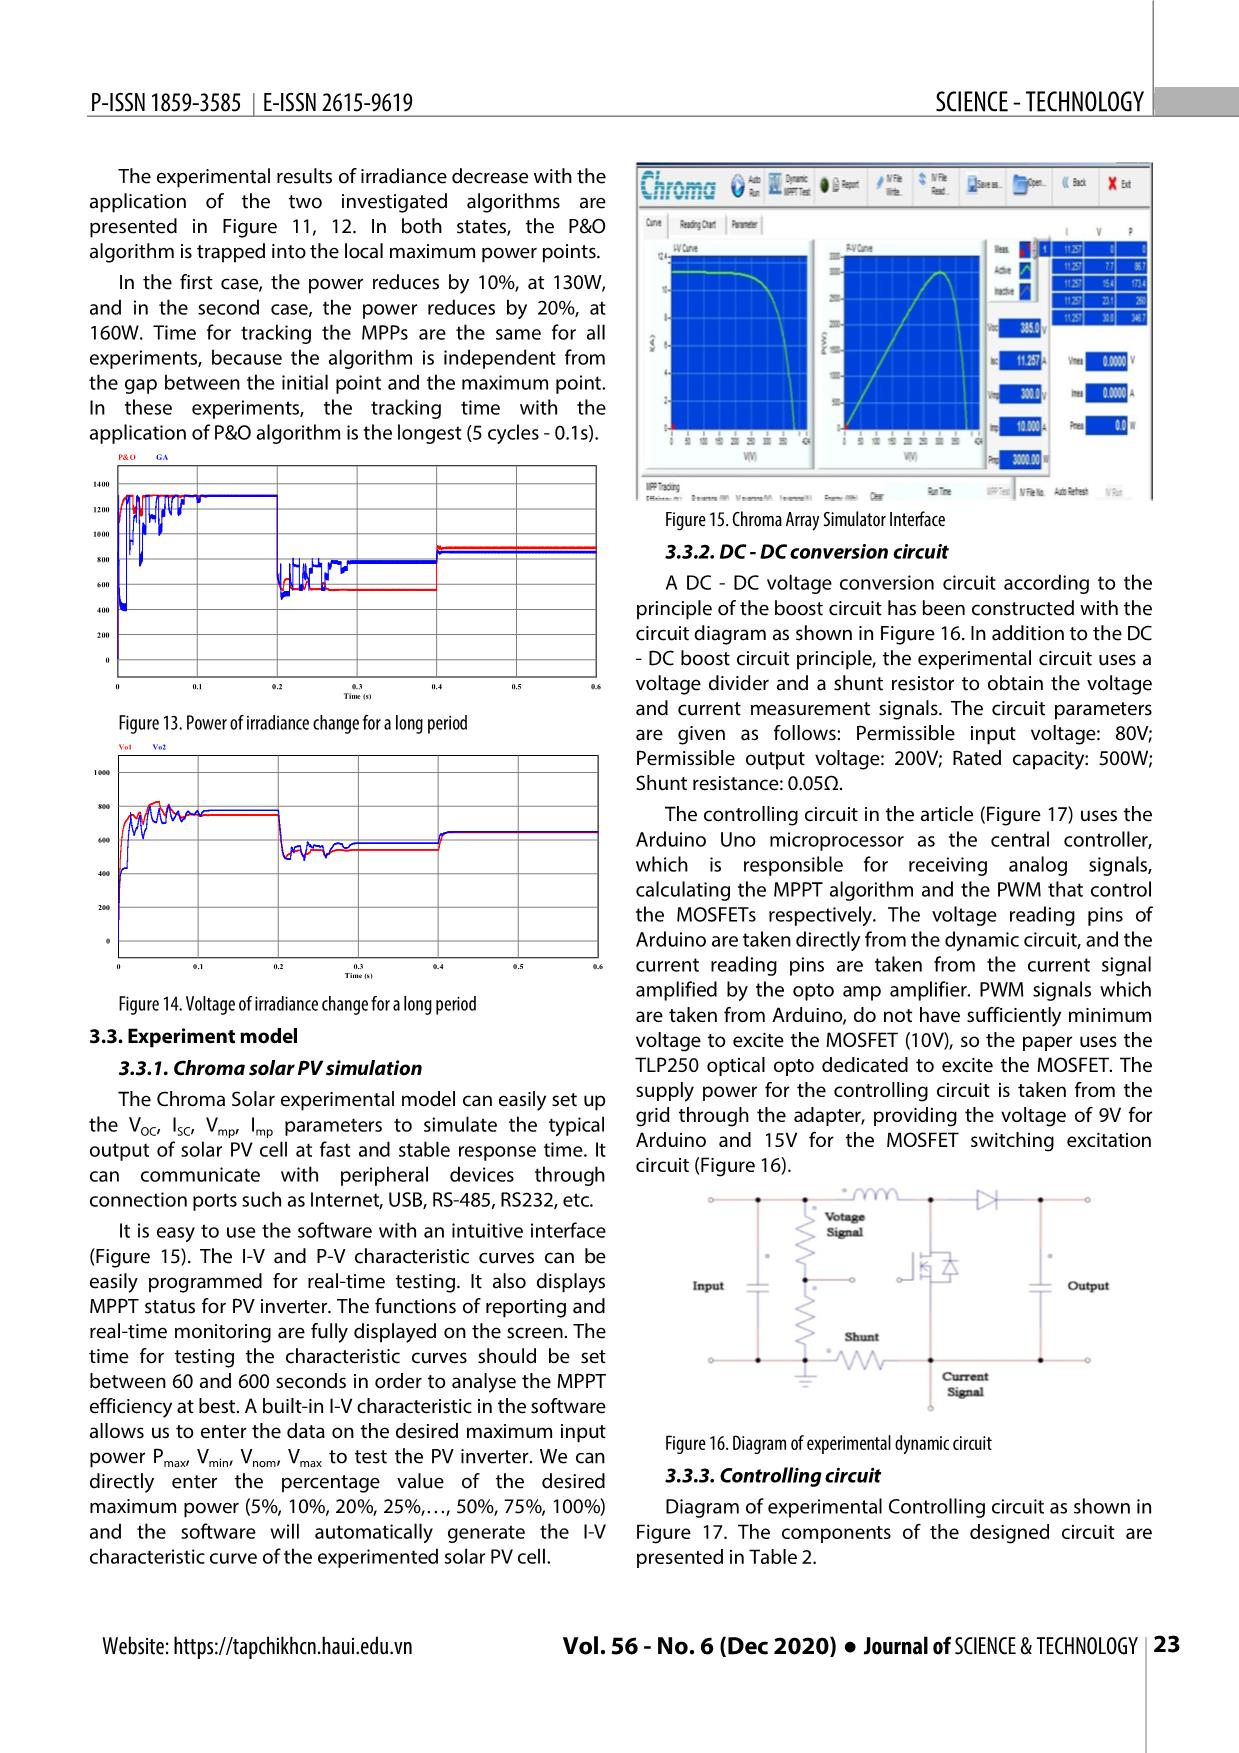
 The experimental results of irradiance decrease with the
application of the two investigated algorithms are
presented in Figure 11, 12. In both states, the P&O
algorithm is trapped into the local maximum power points.
 In the first case, the power reduces by 10%, at 130W,
and in the second case, the power reduces by 20%, at
160W. Time for tracking the MPPs are the same for all
experiments, because the algorithm is independent from
the gap between the initial point and the maximum point.
In these experiments, the tracking time with the
application of P&O algorithm is the longest (5 cycles - 0.1s).
 P&O GA
 1400
 1200
 Figure 15. Chroma Array Simulator Interface
 1000
 800 3.3.2. DC - DC conversion circuit
 600 A DC - DC voltage conversion circuit according to the
 400 principle of the boost circuit has been constructed with the
 200 circuit diagram as shown in Figure 16. In addition to the DC
 0 - DC boost circuit principle, the experimental circuit uses a
 0 0.1 0.2 0.3 0.4 0.5 0.6 voltage divider and a shunt resistor to obtain the voltage
 Time (s)
 and current measurement signals. The circuit parameters
 Figure 13. Power of irradiance change for a long period
 are given as follows: Permissible input voltage: 80V;
 Vo1 Vo2
 Permissible output voltage: 200V; Rated capacity: 500W;
 1000
 Shunt resistance: 0.05Ω.
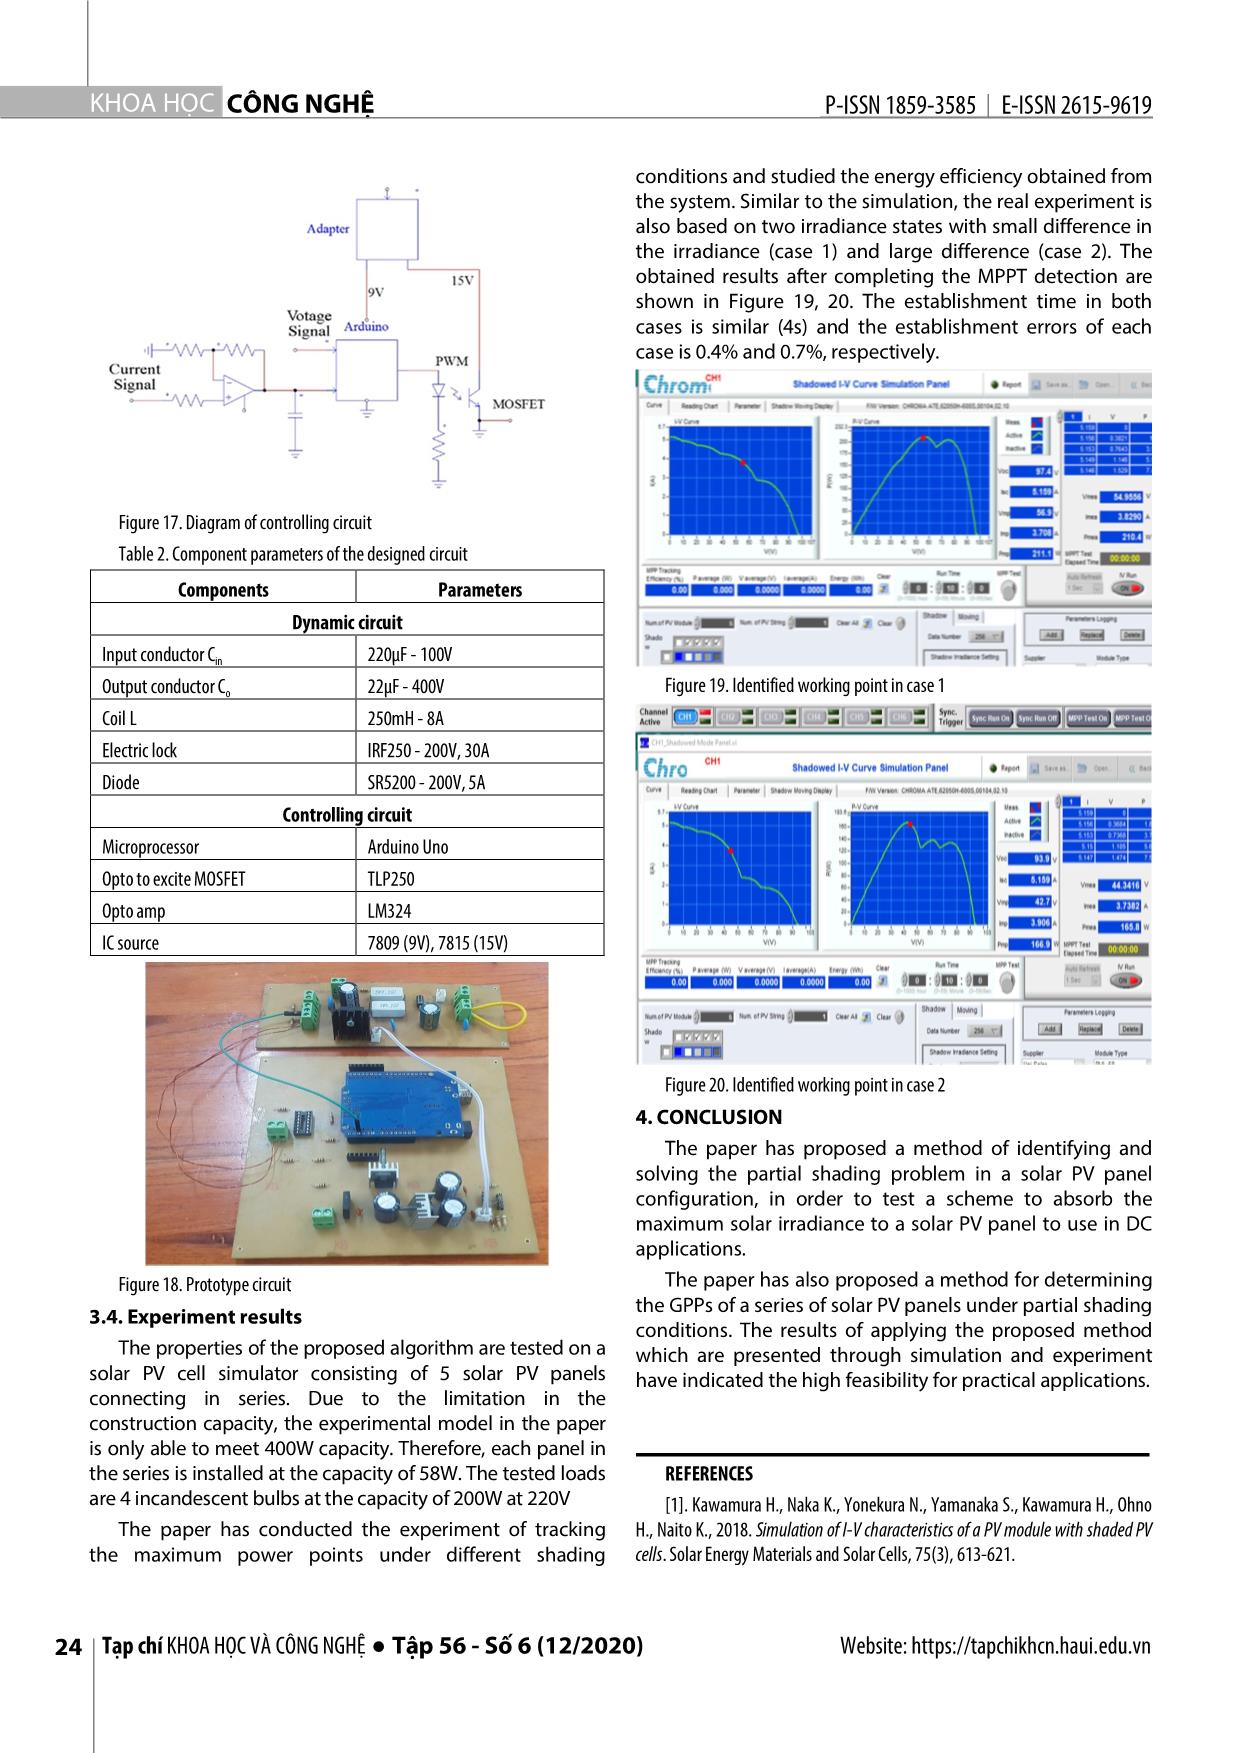
 800 The controlling circuit in the article (Figure 17) uses the
 600 Arduino Uno microprocessor as the central controller,
 400 which is responsible for receiving analog signals,
 calculating the MPPT algorithm and the PWM that control
 200 the MOSFETs respectively. The voltage reading pins of
 0 Arduino are taken directly from the dynamic circuit, and the
 0 0.1 0.2 0.3 0.4 0.5 0.6 current reading pins are taken from the current signal
 Time (s)
 amplified by the opto amp amplifier. PWM signals which
 Figure 14. Voltage of irradiance change for a long period
 are taken from Arduino, do not have sufficiently minimum
3.3. Experiment model voltage to excite the MOSFET (10V), so the paper uses the
 3.3.1. Chroma solar PV simulation TLP250 optical opto dedicated to excite the MOSFET. The
 The Chroma Solar experimental model can easily set up supply power for the controlling circuit is taken from the
 grid through the adapter, providing the voltage of 9V for
the VOC, ISC, Vmp, Imp parameters to simulate the typical
output of solar PV cell at fast and stable response time. It Arduino and 15V for the MOSFET switching excitation
can communicate with peripheral devices through circuit (Figure 16).
connection ports such as Internet, USB, RS-485, RS232, etc.
 It is easy to use the software with an intuitive interface
(Figure 15). The I-V and P-V characteristic curves can be
easily programmed for real-time testing. It also displays
MPPT status for PV inverter. The functions of reporting and
real-time monitoring are fully displayed on the screen. The
time for testing the characteristic curves should be set
between 60 and 600 seconds in order to analyse the MPPT
efficiency at best. A built-in I-V characteristic in the software
allows us to enter the data on the desired maximum input
 Figure 16. Diagram of experimental dynamic circuit
power Pmax, Vmin, Vnom, Vmax to test the PV inverter. We can
directly enter the percentage value of the desired 3.3.3. Controlling circuit
maximum power (5%, 10%, 20%, 25%,, 50%, 75%, 100%) Diagram of experimental Controlling circuit as shown in
and the software will automatically generate the I-V Figure 17. The components of the designed circuit are
characteristic curve of the experimented solar PV cell. presented in Table 2.
 Website: https://tapchikhcn.haui.edu.vn Vol. 56 - No. 6 (Dec 2020) ● Journal of SCIENCE & TECHNOLOGY 23
 KHOA H ỌC CÔNG NGHỆ P - ISSN 1859 - 3585 E - ISSN 2615 - 961 9
 conditions and studied the energy efficiency obtained from
 the system. Similar to the simulation, the real experiment is
 also based on two irradiance states with small difference in
 the irradiance (case 1) and large difference (case 2). The
 obtained results after completing the MPPT detection are
 shown in Figure 19, 20. The establishment time in both
 cases is similar (4s) and the establishment errors of each
 case is 0.4% and 0.7%, respectively.
 Figure 17. Diagram of controlling circuit
 Table 2. Component parameters of the designed circuit
 Components Parameters
 Dynamic circuit
 Input conductor Cin 220µF - 100V
 Output conductor Co 22µF - 400V Figure 19. Identified working point in case 1
 Coil L 250mH - 8A
 Electric lock IRF250 - 200V, 30A
 Diode SR5200 - 200V, 5A
 Controlling circuit
 Microprocessor Arduino Uno
 Opto to excite MOSFET TLP250
 Opto amp LM324
 IC source 7809 (9V), 7815 (15V)
 Figure 20. Identified working point in case 2
 4. CONCLUSION
 The paper has proposed a method of identifying and
 solving the partial shading problem in a solar PV panel
 configuration, in order to test a scheme to absorb the
 maximum solar irradiance to a solar PV panel to use in DC
 applications.
 Figure 18. Prototype circuit The paper has also proposed a method for determining
 the GPPs of a series of solar PV panels under partial shading
 3.4. Experiment results
 conditions. The results of applying the proposed method
 The properties of the proposed algorithm are tested on a which are presented through simulation and experiment
 solar PV cell simulator consisting of 5 solar PV panels have indicated the high feasibility for practical applications.
 connecting in series. Due to the limitation in the
 construction capacity, the experimental model in the paper
 is only able to meet 400W capacity. Therefore, each panel in
 the series is installed at the capacity of 58W. The tested loads REFERENCES
 are 4 incandescent bulbs at the capacity of 200W at 220V [1]. Kawamura H., Naka K., Yonekura N., Yamanaka S., Kawamura H., Ohno
 The paper has conducted the experiment of tracking H., Naito K., 2018. Simulation of I-V characteristics of a PV module with shaded PV
 the maximum power points under different shading cells. Solar Energy Materials and Solar Cells, 75(3), 613-621.
24 Tạp chí KHOA HỌC VÀ CÔNG NGHỆ ● Tập 56 - Số 6 (12/2020) Website: https://tapchikhcn.haui.edu.vn
P-ISSN 1859-3585 E-ISSN 2615-9619 SCIENCE - TECHNOLOGY
 [2]. Mao M., Duan Q., Yang Z., Duan P., 2016. Modeling and global MPPT for [18]. Ishaque K., Salam Z., 2011. A comprehensive MATLAB Simulink PV
PV system under partial shading conditions using modified artificial fish swarm system simulator with partial shading capability based on two-diode model. Solar
algorithm. In Systems Engineering (ISSE), 2016 IEEE International Symposium on Energy, 85(9), 2217-2227.
(pp. 1-7). IEEE. [19]. Bidram A., Davoudi A., Balog R. S., 2012. Control and circuit techniques
 [3]. Gollop F. M., Roberts M. J., 2014. Environmental regulations and to mitigate partial shading effects in photovoltaic arrays. IEEE Journal of
productivity growth: The case of fossil-fueled electric power generation. Journal of Photovoltaics, 2(4), 532-546.
political Economy, 91(4), 654-674.
 [20]. Ishaque K., Salam Z. 2018. A review of maximum power point tracking
 [4]. International Energy Agency (IEA) Bioenergy, 2019. Bioenergy: A
 techniques of PV system for uniform insolation and partial shading condition.
Sustainable and Reliable Energy Source, Executive Summary. prepared by the
 Renewable and Sustainable Energy Reviews, 19, 475-488.
Energy Research Centre of the Netherlands (ECN), E4tech, Chalmers University of
Technology and the Copernicus Institute of the University of Utrecht.
 [5]. Tsai H. L., Tu C. S., Su, Y. J., 2018. Development of generalized THÔNG TIN TÁC GIẢ
photovoltaic model using MATLAB/SIMULINK. In Proceedings of the world Nguyễn Đức Minh1, Đỗ Như Ý2, Trịnh Trọng Chưởng3
congress on Engineering and computer science (Vol. 2018, pp. 1-6). 1Viện Khoa học năng lượng, Viện Hàn lâm Khoa học và Công nghệ Việt Nam
 [6]. Park S. H., Cha G. R., Jung Y. C., Won C. Y., 2010. Design and application 2Trường Đại học Mỏ - Địa chất
for PV generation system using a soft-switching boost converter with SARC. IEEE
 3Trường Đại học Công nghiệp Hà Nội
Transactions on Industrial Electronics, 57(2), 515-522.
 [7]. Patel H., Agarwal V., 2008. MATLAB-based modeling to study the effects
of partial shading on PV array characteristics. IEEE transactions on energy
conversion, 23(1), 302-310.
 [8]. Mäki A., Valkealahti S., 2012. Power losses in long string and parallel-
connected short strings of series-connected silicon-based photovoltaic modules due to
partial shading conditions. IEEE Transactions on Energy Conversion, 27(1), 173-183.
 [9]. Paraskevadaki E. V., Papathanassiou S. A., 2017. Evaluation of MPP
voltage and power of mc-Si PV modules in partial shading conditions. IEEE
Transactions on Energy Conversion, 26(3), 923-932.
 [10]. Ding K., Bian X., Liu H., Peng T., 2016. A MATLAB-simulink-based PV
module model and its application under conditions of nonuniform irradiance. IEEE
Transactions on Energy Conversion, 27(4), 864-872.
 [11]. Ji Y. H., Jung D. Y., Kim J. G., Kim J. H., Lee T. W., Won C. Y., 2018. A real
maximum power point tracking method for mismatching compensation in PV array
under partially shaded conditions. IEEE Transactions on power electronics, 26(4),
1001-1009.
 [12]. Koutroulis E., Blaabjerg F., 2012. A new technique for tracking the global
maximum power point of PV arrays operating under partial-shading conditions.
IEEE Journal of Photovoltaics, 2(2), 184-190.
 [13]. Spertino F., Akilimali J. S., 2009. Are Manufacturing I–V Mismatch and
Reverse Currents Key Factors in Large Photovoltaic Arrays?. IEEE Transactions on
Industrial Electronics, 56(11), 4520-4531.
 [14]. Mastromauro R. A., Liserre M., Dell'Aquila A., 2012. Control issues in
single-stage photovoltaic systems: MPPT, current and voltage control. IEEE
Transactions on Industrial Informatics, 8(2), 241-254.
 [15]. Mäki A., Valkealahti S., 2012. Power losses in long string and parallel-
connected short strings of series-connected silicon-based photovoltaic modules due
to partial shading conditions. IEEE Transactions on Energy Conversion, 27(1),
173-183.
 [16]. Molenbroek E., Waddington D. W., Emery K. A., 1991. Hot spot
susceptibility and testing of PV modules. In Photovoltaic Specialists Conference,
2011., Conference Record of the Twenty Second IEEE (pp. 547-552). IEEE.
 [17]. Silvestre S., Boronat A., Chouder A., 2013. Study of bypass diodes
configuration on PV modules. Applied Energy, 86(9), 1632-1640.
 Website: https://tapchikhcn.haui.edu.vn Vol. 56 - No. 6 (Dec 2020) ● Journal of SCIENCE & TECHNOLOGY 25
File đính kèm:
 phat_trien_thuat_toan_xac_dinh_diem_toi_uu_toan_cuc_cua_pin.pdf

