NO2 gas sensing characteristics of SNO2 nanofiber - based sensors
In this work, the SnO2 nanofibers (NFs) were directly synthesized through a electrospinning method
following the annealing treatment process at 600 °C for 3h. The morphological, compositional, crystal
properties of material were characterized using field emission scanning electron microscopy (FESEM),
energy dispersive X-ray spectroscopy (EDX), X-ray diffraction (XRD), respectively. The FESEM images of
SnO2 NFs shows the typical spider-net like morphology with ∼ 150 nm in diameter. Besides, the EDX
spectrum reveals the presence of Sn and O atoms in the synthesized nanofibers. The XRD exhibited the
formation of crystalline phases of tetragonal SnO2. The gas sensing properties of fibers were tested towards
NO2 gas as a function concentration within a temperature range of 250 to 450 °C. Under the optimal
operating temperature of 350 °C, the SnO2 NF sensors can be detected NO2 gas at low concentration down
to 0.015 ppm. These results show its ability for NO2 gas detection in gas sensor application.
Trang 1
Trang 2
Trang 3
Trang 4
Trang 5
Tóm tắt nội dung tài liệu: NO2 gas sensing characteristics of SNO2 nanofiber - based sensors
d rain, which affects human life and plant
development [2]. Furthermore, it can be reacted and
destructed the ozone layer [2]. Therefore, it is
important to detect and monitor the NO2 gas emitted
into the air. One-dimensional (1D) nanostructures,
including nanowires, nanorods, nanotubes, nanobelts,
and NFs were widely used as a gas sensing element.
Among them, the NFs was exhibited its outstanding
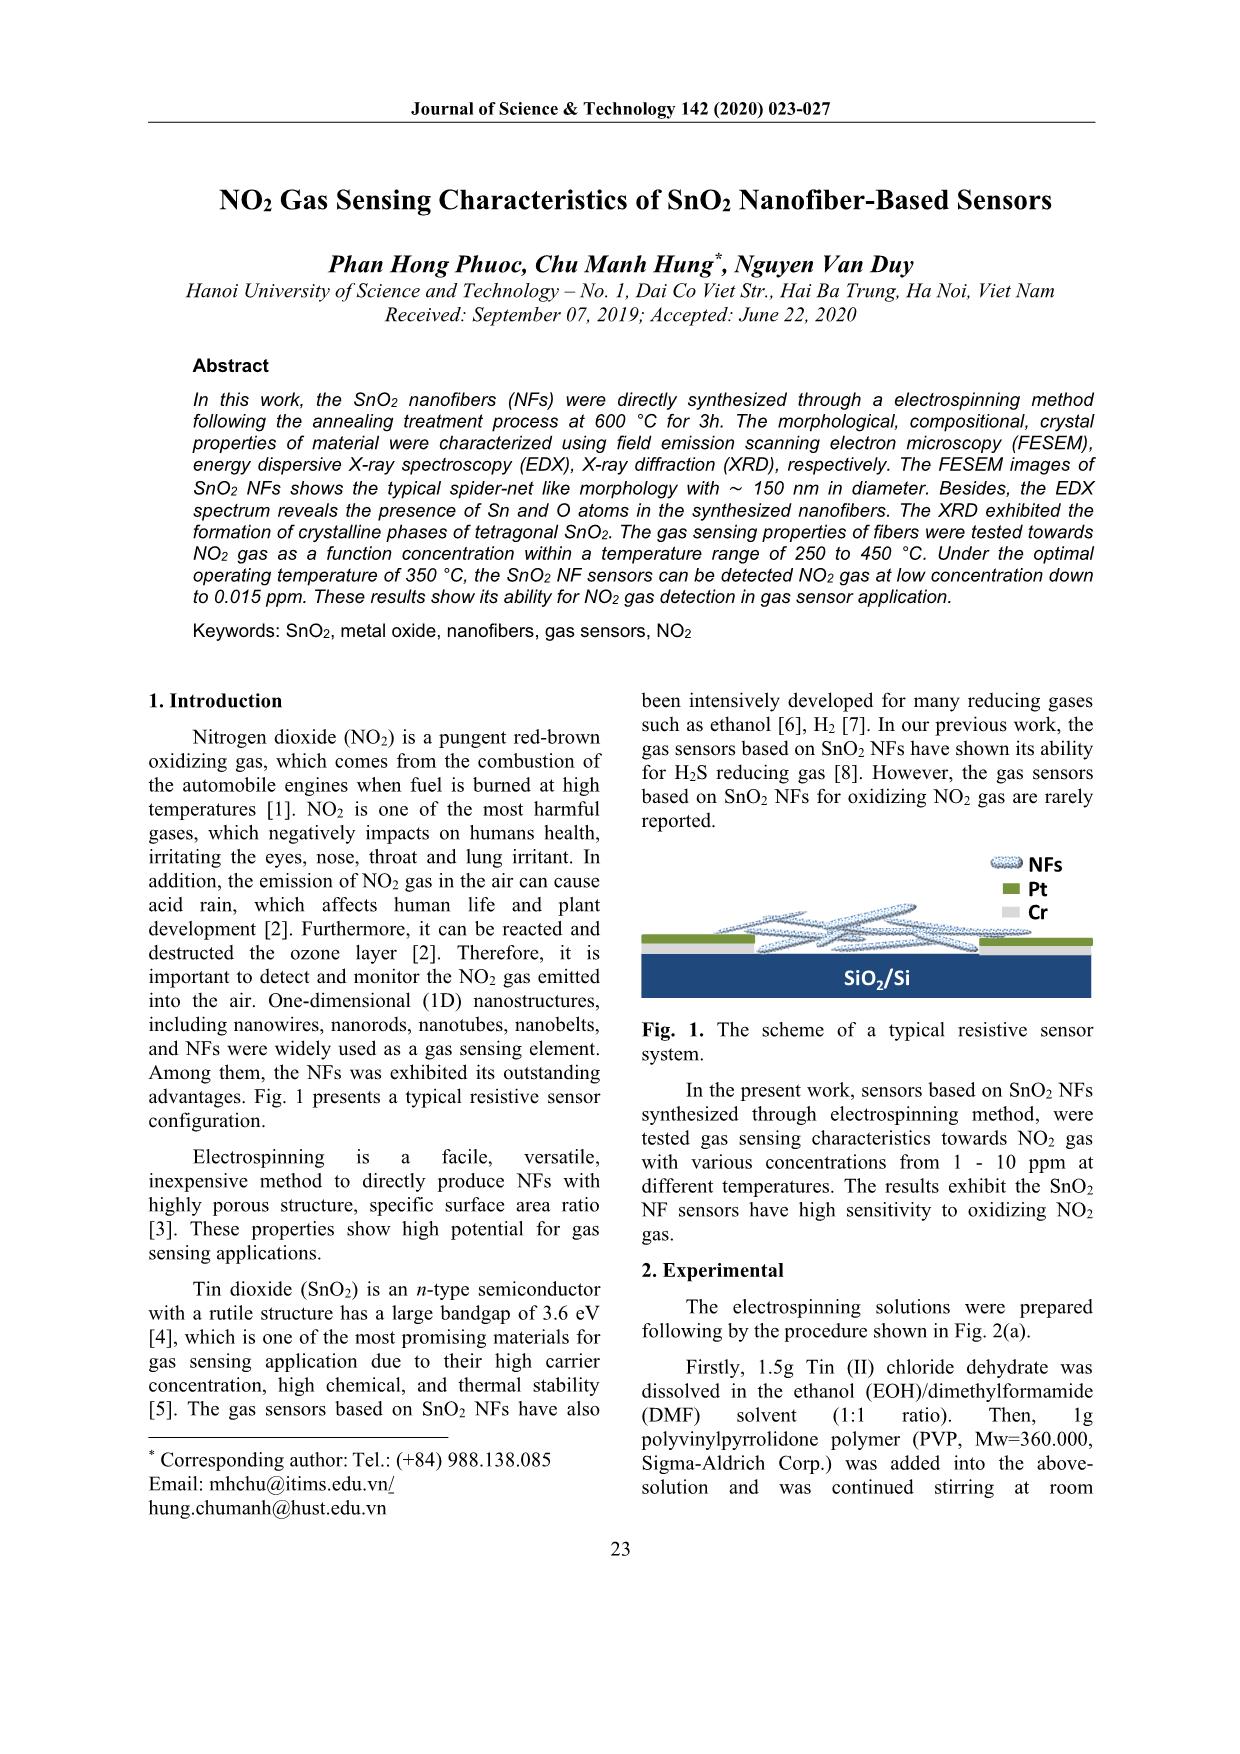
advantages. Fig. 1 presents a typical resistive sensor
configuration.
Electrospinning is a facile, versatile,
inexpensive method to directly produce NFs with
highly porous structure, specific surface area ratio
[3]. These properties show high potential for gas
sensing applications.
Tin dioxide (SnO2) is an n-type semiconductor
with a rutile structure has a large bandgap of 3.6 eV
[4], which is one of the most promising materials for
gas sensing application due to their high carrier
concentration, high chemical, and thermal stability
[5]. The gas sensors based on SnO2 NFs have also
* Corresponding author: Tel.: (+84) 988.138.085
Email: mhchu@itims.edu.vn/
hung.chumanh@hust.edu.vn
been intensively developed for many reducing gases
such as ethanol [6], H2 [7]. In our previous work, the
gas sensors based on SnO2 NFs have shown its ability
for H2S reducing gas [8]. However, the gas sensors
based on SnO2 NFs for oxidizing NO2 gas are rarely
reported.
SiO2/Si
Cr
Pt
NFs
Fig. 1. The scheme of a typical resistive sensor
system.
In the present work, sensors based on SnO2 NFs
synthesized through electrospinning method, were
tested gas sensing characteristics towards NO2 gas
with various concentrations from 1 - 10 ppm at
different temperatures. The results exhibit the SnO2
NF sensors have high sensitivity to oxidizing NO2
gas.
2. Experimental
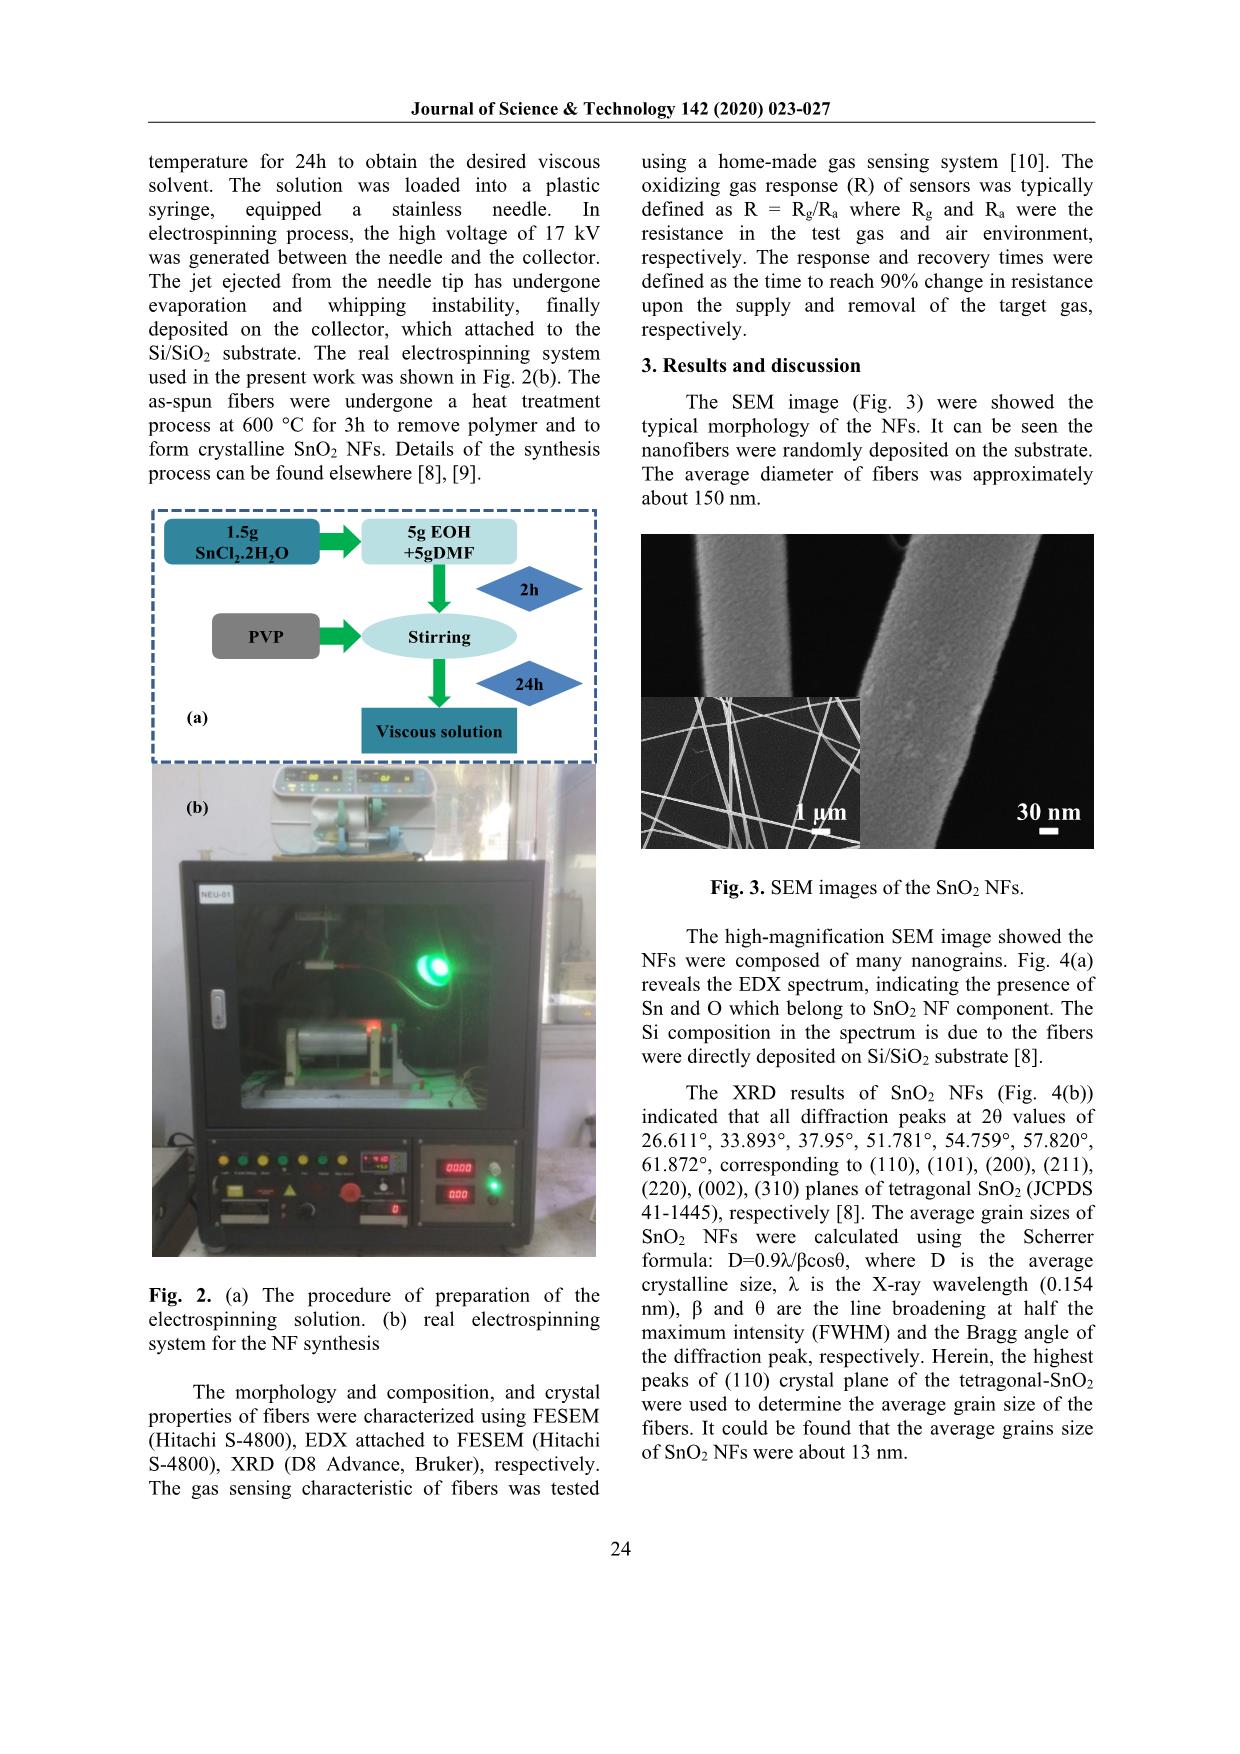
The electrospinning solutions were prepared
following by the procedure shown in Fig. 2(a).
Firstly, 1.5g Tin (II) chloride dehydrate was
dissolved in the ethanol (EOH)/dimethylformamide
(DMF) solvent (1:1 ratio). Then, 1g
polyvinylpyrrolidone polymer (PVP, Mw=360.000,
Sigma-Aldrich Corp.) was added into the above-
solution and was continued stirring at room
Journal of Science & Technology 142 (2020) 023-027
24
temperature for 24h to obtain the desired viscous
solvent. The solution was loaded into a plastic
syringe, equipped a stainless needle. In
electrospinning process, the high voltage of 17 kV
was generated between the needle and the collector.
The jet ejected from the needle tip has undergone
evaporation and whipping instability, finally
deposited on the collector, which attached to the
Si/SiO2 substrate. The real electrospinning system
used in the present work was shown in Fig. 2(b). The
as-spun fibers were undergone a heat treatment
process at 600 °C for 3h to remove polymer and to
form crystalline SnO2 NFs. Details of the synthesis
process can be found elsewhere [8], [9].
Stirring
5g EOH
+5gDMF
Viscous solution
1.5g
SnCl2.2H2O
PVP
2h
24h
(a)
(b)
Fig. 2. (a) The procedure of preparation of the
electrospinning solution. (b) real electrospinning
system for the NF synthesis
The morphology and composition, and crystal
properties of fibers were characterized using FESEM
(Hitachi S-4800), EDX attached to FESEM (Hitachi
S-4800), XRD (D8 Advance, Bruker), respectively.
The gas sensing characteristic of fibers was tested
using a home-made gas sensing system [10]. The
oxidizing gas response (R) of sensors was typically
defined as R = Rg/Ra where Rg and Ra were the
resistance in the test gas and air environment,
respectively. The response and recovery times were
defined as the time to reach 90% change in resistance
upon the supply and removal of the target gas,
respectively.
3. Results and discussion
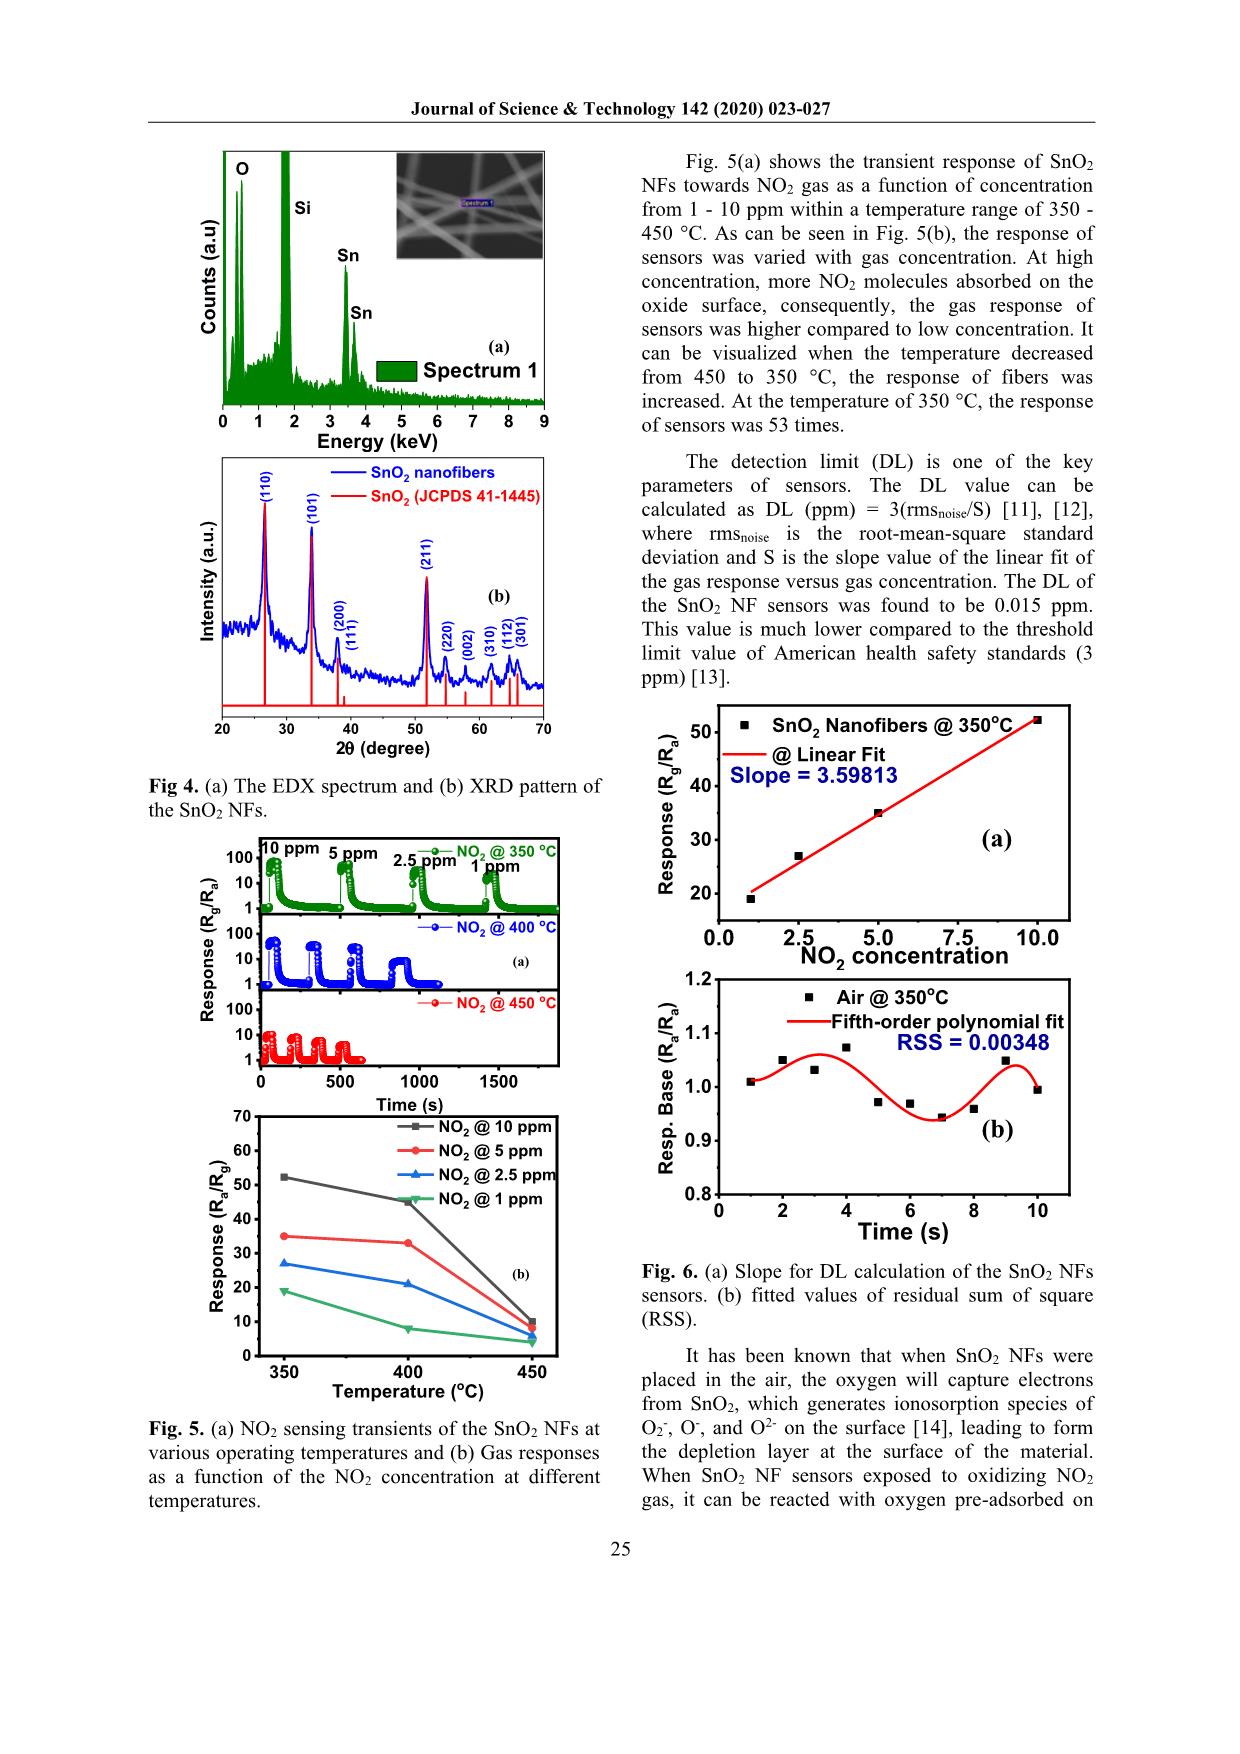
The SEM image (Fig. 3) were showed the
typical morphology of the NFs. It can be seen the
nanofibers were randomly deposited on the substrate.
The average diameter of fibers was approximately
about 150 nm.
30 nm1 µm
Fig. 3. SEM images of the SnO2 NFs.
The high-magnification SEM image showed the
NFs were composed of many nanograins. Fig. 4(a)
reveals the EDX spectrum, indicating the presence of
Sn and O which belong to SnO2 NF component. The
Si composition in the spectrum is due to the fibers
were directly deposited on Si/SiO2 substrate [8].
The XRD results of SnO2 NFs (Fig. 4(b))
indicated that all diffraction peaks at 2θ values of
26.611°, 33.893°, 37.95°, 51.781°, 54.759°, 57.820°,
61.872°, corresponding to (110), (101), (200), (211),
(220), (002), (310) planes of tetragonal SnO2 (JCPDS
41-1445), respectively [8]. The average grain sizes of
SnO2 NFs were calculated using the Scherrer
formula: D=0.9λ/βcosθ, where D is the average
crystalline size, λ is the X-ray wavelength (0.154
nm), β and θ are the line broadening at half the
maximum intensity (FWHM) and the Bragg angle of
the diffraction peak, respectively. Herein, the highest
peaks of (110) crystal plane of the tetragonal-SnO2
were used to determine the average grain size of the
fibers. It could be found that the average grains size
of SnO2 NFs were about 13 nm.
Journal of Science & Technology 142 (2020) 023-027
25
0 1 2 3 4 5 6 7 8 9
C
o
u
n
ts
 (
a
.u
)
 Spectrum 1
Sn
Sn
Si
O
Energy (keV)
(a)
(b)
20 30 40 50 60 70
(3
0
1
)
(1
1
2
)
(1
1
1
)
In
te
n
s
it
y
 (
a
.u
.)
2q (degree)
 SnO2 nanofibers
 SnO2 (JCPDS 41-1445)(
1
1
0
)
(1
0
1
)
(2
0
0
)
(2
1
1
)
(2
2
0
)
(0
0
2
)
(3
1
0
)
Fig 4. (a) The EDX spectrum and (b) XRD pattern of
the SnO2 NFs.
(b)
(a)
0 500 1000 1500
1
10
100
1
10
100
1
10
100
Time (s)
 NO2 @ 450
oC
 NO2 @ 400
oC
2.5 ppm 1 ppm
5 ppm
R
e
s
p
o
n
s
e
 (
R
g
/R
a
)
 NO2 @ 350
oC10 ppm
350 400 450
0
10
20
30
40
50
60
70
R
e
s
p
o
n
s
e
 (
R
a
/R
g
)
Temperature (oC)
 NO2 @ 10 ppm
 NO2 @ 5 ppm
 NO2 @ 2.5 ppm
 NO2 @ 1 ppm
Fig. 5. (a) NO2 sensing transients of the SnO2 NFs at
various operating temperatures and (b) Gas responses
as a function of the NO2 concentration at different
temperatures.
Fig. 5(a) shows the transient response of SnO2
NFs towards NO2 gas as a function of concentration
from 1 - 10 ppm within a temperature range of 350 -
450 °C. As can be seen in Fig. 5(b), the response of
sensors was varied with gas concentration. At high
concentration, more NO2 molecules absorbed on the
oxide surface, consequently, the gas response of
sensors was higher compared to low concentration. It
can be visualized when the temperature decreased
from 450 to 350 °C, the response of fibers was
increased. At the temperature of 350 °C, the response
of sensors was 53 times.
The detection limit (DL) is one of the key
parameters of sensors. The DL value can be
calculated as DL (ppm) = 3(rmsnoise/S) [11], [12],
where rmsnoise is the root-mean-square standard
deviation and S is the slope value of the linear fit of
the gas response versus gas concentration. The DL of
the SnO2 NF sensors was found to be 0.015 ppm.
This value is much lower compared to the threshold
limit value of American health safety standards (3
ppm) [13].
(a)
(b)
0.0 2.5 5.0 7.5 10.0
20
30
40
50
Slope = 3.59813
R
e
s
p
o
n
s
e
 (
R
g
/R
a
)
 SnO2 Nanofibers @ 350
oC
 @ Linear Fit
NO2 concentration
0 2 4 6 8 10
0.8
0.9
1.0
1.1
1.2
RSS = 0.00348
R
e
s
p
.
B
a
s
e
 (
R
a
/R
a
)
 Air @ 350oC
Fifth-order polynomial fit
Time (s)
Fig. 6. (a) Slope for DL calculation of the SnO2 NFs
sensors. (b) fitted values of residual sum of square
(RSS).
It has been known that when SnO2 NFs were
placed in the air, the oxygen will capture electrons
from SnO2, which generates ionosorption species of
O2-, O-, and O2- on the surface [14], leading to form
the depletion layer at the surface of the material.
When SnO2 NF sensors exposed to oxidizing NO2
gas, it can be reacted with oxygen pre-adsorbed on
Journal of Science & Technology 142 (2020) 023-027
26
the surface of the material or directly trapping
electrons from the conduction band. The competition
absorbed reaction can take place between oxygen and
oxidizing gas as anionic ions. The adsorption of NO2
gas is considerably stronger compared to oxygen
[15], [16]. In this case, the adsorbed reaction of NO2
gas on the surface of n-type semiconductor may be
dominated, which can be described in the following
equation [17], [18]:
NO2(gas) + e- ↔ NO2-(ads)
NO2(gas) + 2O-(ads) ↔ NO2-(ads) + O2(gas) + e-
2NO2(gas) + O2-(ads) + 2e- ↔ 2NO2-(ads) + 2O-(ads)
NO2-(ads) + 2O-(ads) + e- ↔ NO(gas) + ½ O2(gas) + 2O2-(ads)
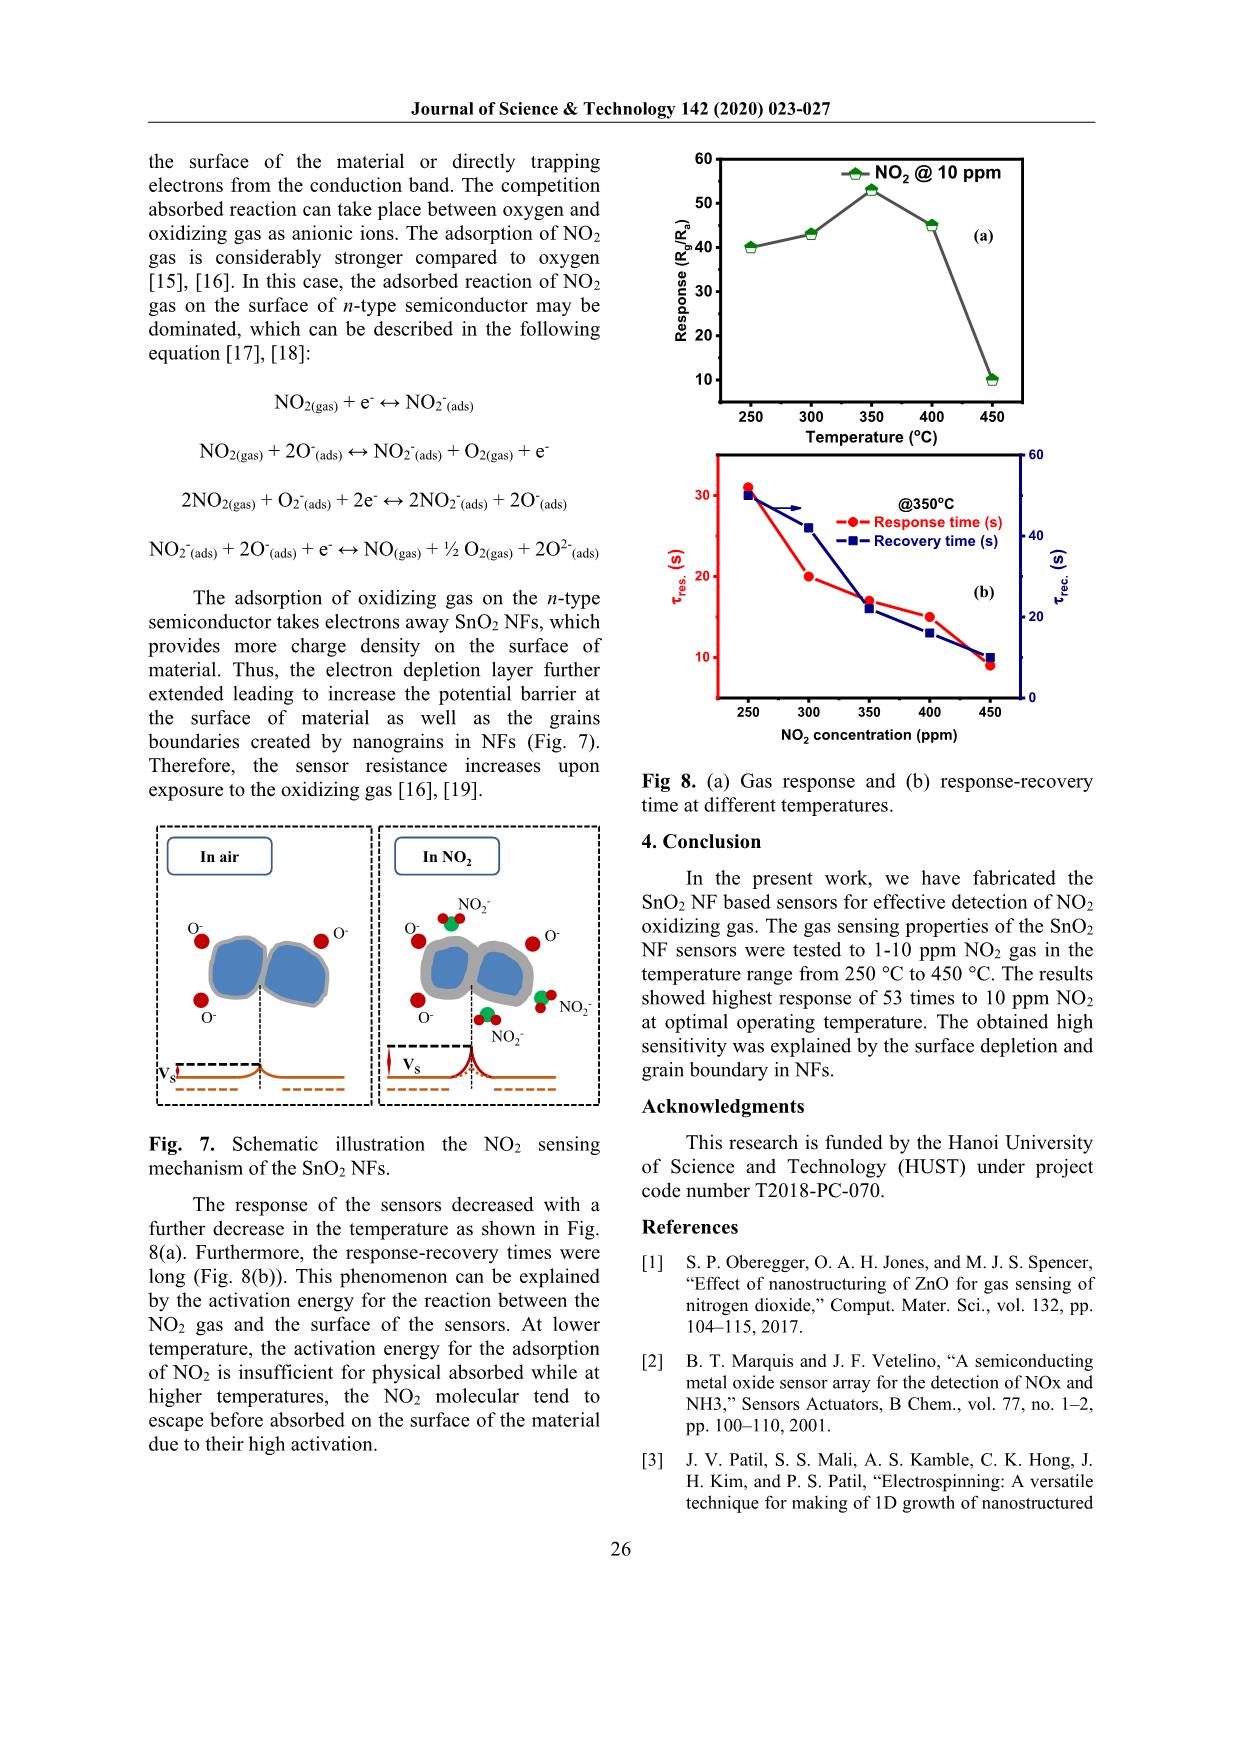
The adsorption of oxidizing gas on the n-type
semiconductor takes electrons away SnO2 NFs, which
provides more charge density on the surface of
material. Thus, the electron depletion layer further
extended leading to increase the potential barrier at
the surface of material as well as the grains
boundaries created by nanograins in NFs (Fig. 7).
Therefore, the sensor resistance increases upon
exposure to the oxidizing gas [16], [19].
In air
O-
O-O
-
In NO2
O-
O-
O-
NO2
-
NO2
-
NO2
-
VSVS
Fig. 7. Schematic illustration the NO2 sensing
mechanism of the SnO2 NFs.
The response of the sensors decreased with a
further decrease in the temperature as shown in Fig.
8(a). Furthermore, the response-recovery times were
long (Fig. 8(b)). This phenomenon can be explained
by the activation energy for the reaction between the
NO2 gas and the surface of the sensors. At lower
temperature, the activation energy for the adsorption
of NO2 is insufficient for physical absorbed while at
higher temperatures, the NO2 molecular tend to
escape before absorbed on the surface of the material
due to their high activation.
(a)
(b)
250 300 350 400 450
10
20
30
 Response time (s)
 Recovery time (s)
NO2 concentration (ppm)
t r
e
s
. (
s
)
@350oC
0
20
40
60
t r
e
c
. (
s
)
250 300 350 400 450
10
20
30
40
50
60
R
e
s
p
o
n
s
e
 (
R
g
/R
a
)
 NO2 @ 10 ppm
Temperature (oC)
Fig 8. (a) Gas response and (b) response-recovery
time at different temperatures.
4. Conclusion
In the present work, we have fabricated the
SnO2 NF based sensors for effective detection of NO2
oxidizing gas. The gas sensing properties of the SnO2
NF sensors were tested to 1-10 ppm NO2 gas in the
temperature range from 250 °C to 450 °C. The results
showed highest response of 53 times to 10 ppm NO2
at optimal operating temperature. The obtained high
sensitivity was explained by the surface depletion and
grain boundary in NFs.
Acknowledgments
This research is funded by the Hanoi University
of Science and Technology (HUST) under project
code number T2018-PC-070.
References
[1] S. P. Oberegger, O. A. H. Jones, and M. J. S. Spencer,
“Effect of nanostructuring of ZnO for gas sensing of
nitrogen dioxide,” Comput. Mater. Sci., vol. 132, pp.
104–115, 2017.
[2] B. T. Marquis and J. F. Vetelino, “A semiconducting
metal oxide sensor array for the detection of NOx and
NH3,” Sensors Actuators, B Chem., vol. 77, no. 1–2,
pp. 100–110, 2001.
[3] J. V. Patil, S. S. Mali, A. S. Kamble, C. K. Hong, J.
H. Kim, and P. S. Patil, “Electrospinning: A versatile
technique for making of 1D growth of nanostructured
Journal of Science & Technology 142 (2020) 023-027
27
nanofibers and its applications: An experimental
approach,” Appl. Surf. Sci., vol. 423, pp. 641–674,
2017.
[4] X. Kou et al., “Superior acetone gas sensor based on
electrospun SnO2 nanofibers by Rh doping,” Sensors
Actuators, B Chem., vol. 256, pp. 861–869, 2018.
[5] J. Y. Park, K. Asokan, S. W. Choi, and S. S. Kim,
“Growth kinetics of nanograins in SnO2 fibers and
size dependent sensing properties,” Sensors
Actuators, B Chem., vol. 152, no. 2, pp. 254–260,
2011.
[6] Y. Zhang, X. He, J. Li, Z. Miao, and F. Huang,
“Fabrication and ethanol-sensing properties of micro
gas sensor based on electrospun SnO2 nanofibers,”
Sensors Actuators, B Chem., vol. 132, no. 1, pp. 67–
73, 2008.
[7] L. Liu, C. Guo, S. Li, L. Wang, Q. Dong, and W. Li,
“Improved H2 sensing properties of Co-doped SnO2
nanofibers,” Sensors Actuators, B Chem., vol. 150,
no. 2, pp. 806–810, 2010.
[8] P. H. Phuoc, C. M. Hung, N. Van Toan, and N. Van
Duy, “One-step fabrication of SnO 2 porous
nanofiber gas sensors for sub-ppm H 2 S detection,”
Submitt. to Sensors Actuators A, no. 1, 2019.
[9] N. Van Hoang, C. M. Hung, N. D. Hoa, N. Van Duy,
and N. Van Hieu, “Facile on-chip electrospinning of
ZnFe 2 O 4 nanofiber sensors with excellent sensing
performance to H 2 S down ppb level,” J. Hazard.
Mater., vol. 360, no. July, pp. 6–16, 2018.
[10] L. V. Thong, L. T. N. Loan, and N. Van Hieu,
“Comparative study of gas sensor performance of
SnO2 nanowires and their hierarchical
nanostructures,” Sensors Actuators, B Chem., vol.
150, no. 1, pp. 112–119, 2010.
[11] L. A. Currie, “Nomenclature in evaluation of
analytical methods including detection and
quantification capabilities (IUPAC Recommendations
1995),” Anal. Chim. Acta, vol. 391, no. 2, pp. 105–
126, 1999.
[12] N. Van Hoang, C. M. Hung, N. D. Hoa, N. Van Duy,
I. Park, and N. Van Hieu, “Excellent detection of H2S
gas at ppb concentrations using ZnFe2O4 nanofibers
loaded with reduced graphene oxide,” Sensors
Actuators B Chem., vol. 282, pp. 876–884, Mar.
2019.
[13] National Institute for Occupational Safety and Health,
“Threshold Limit Values ( TLV ) and Immediately
Dangerous to Life and Health ( IDLH ) values,” Saf.
Heal., p. 900, 2005.
[14] P. Feng, Q. Wan, and T. H. Wang, “Contact-
controlled sensing properties of flowerlike ZnO
nanostructures,” Appl. Phys. Lett., vol. 87, no. 21, pp.
1–3, 2005.
[15] N. As and G. A. S. S. Devices, Gas Sensing Devices
Metal Oxide. .
[16] N. G. Cho, D. J. Yang, M. J. Jin, H. G. Kim, H. L.
Tuller, and I. D. Kim, “Highly sensitive SnO2 hollow
nanofiber-based NO2 gas sensors,” Sensors
Actuators, B Chem., vol. 160, no. 1, pp. 1468–1472,
2011.
[17] P. Rai and Y. T. Yu, “Citrate-assisted hydrothermal
synthesis of single crystalline ZnO nanoparticles for
gas sensor application,” Sensors Actuators, B Chem.,
vol. 173, no. June, pp. 58–65, 2012.
[18] A. Mirzaei, B. Hashemi, and K. Janghorban, “α-Fe 2
O 3 based nanomaterials as gas sensors,” J. Mater.
Sci. Mater. Electron., vol. 27, no. 4, pp. 3109–3144,
2016.
[19] A. A. Haidry, N. Kind, and B. Saruhan,
“Investigating the influence of Al-doping and
background humidity on NO2 sensing characteristics
of magnetron-sputtered SnO2 sensors,” J. Sensors
Sens. Syst., vol. 4, no. 2, pp. 271–280, 2015.
File đính kèm:
 no2_gas_sensing_characteristics_of_sno2_nanofiber_based_sens.pdf

