Improving operational efficiency of grids by integrating geographic maps in scada system: Danang study case
The continuous development of the present-day smartgrid technology is
required to improve the operational efficiency of the power system. Energy management
system (EMS) technology solutions, including Supervisory Control And Data Acquisition
(SCADA) and Distribution Management System (DMS), must be constantly developed in
terms of application range and efficiency to meet the mentioned requirements. The
article proposes a technique to integrate Google Earth geographic map into the SCADA
system. The efficiency of the proposed method is evaluated through PSS/ADEPT
software. The results show that the proposed solution contributes to improving the
reliability of the grid and improving the efficiency of customer care service as well as
training of junior dispatchers.

Trang 1

Trang 2

Trang 3

Trang 4

Trang 5

Trang 6

Trang 7

Trang 8
Tóm tắt nội dung tài liệu: Improving operational efficiency of grids by integrating geographic maps in scada system: Danang study case

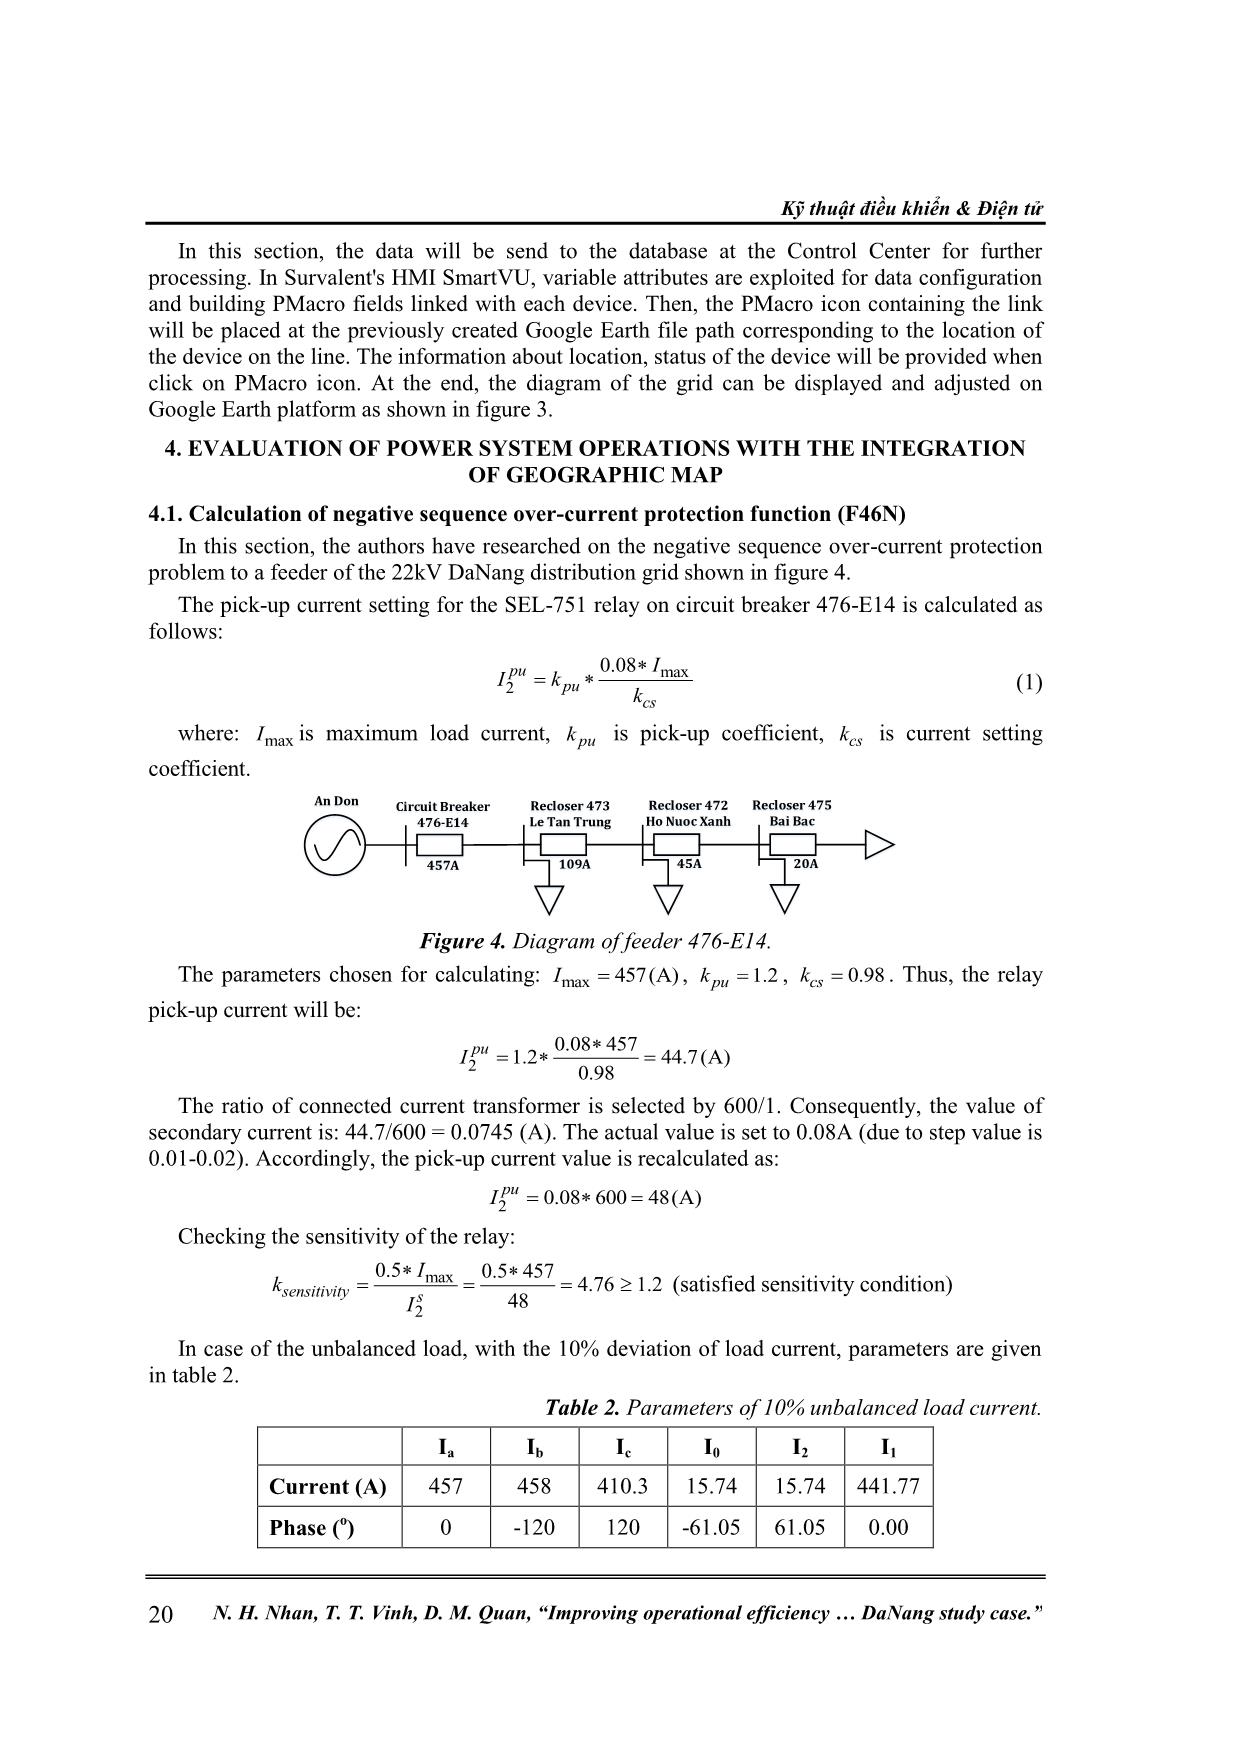
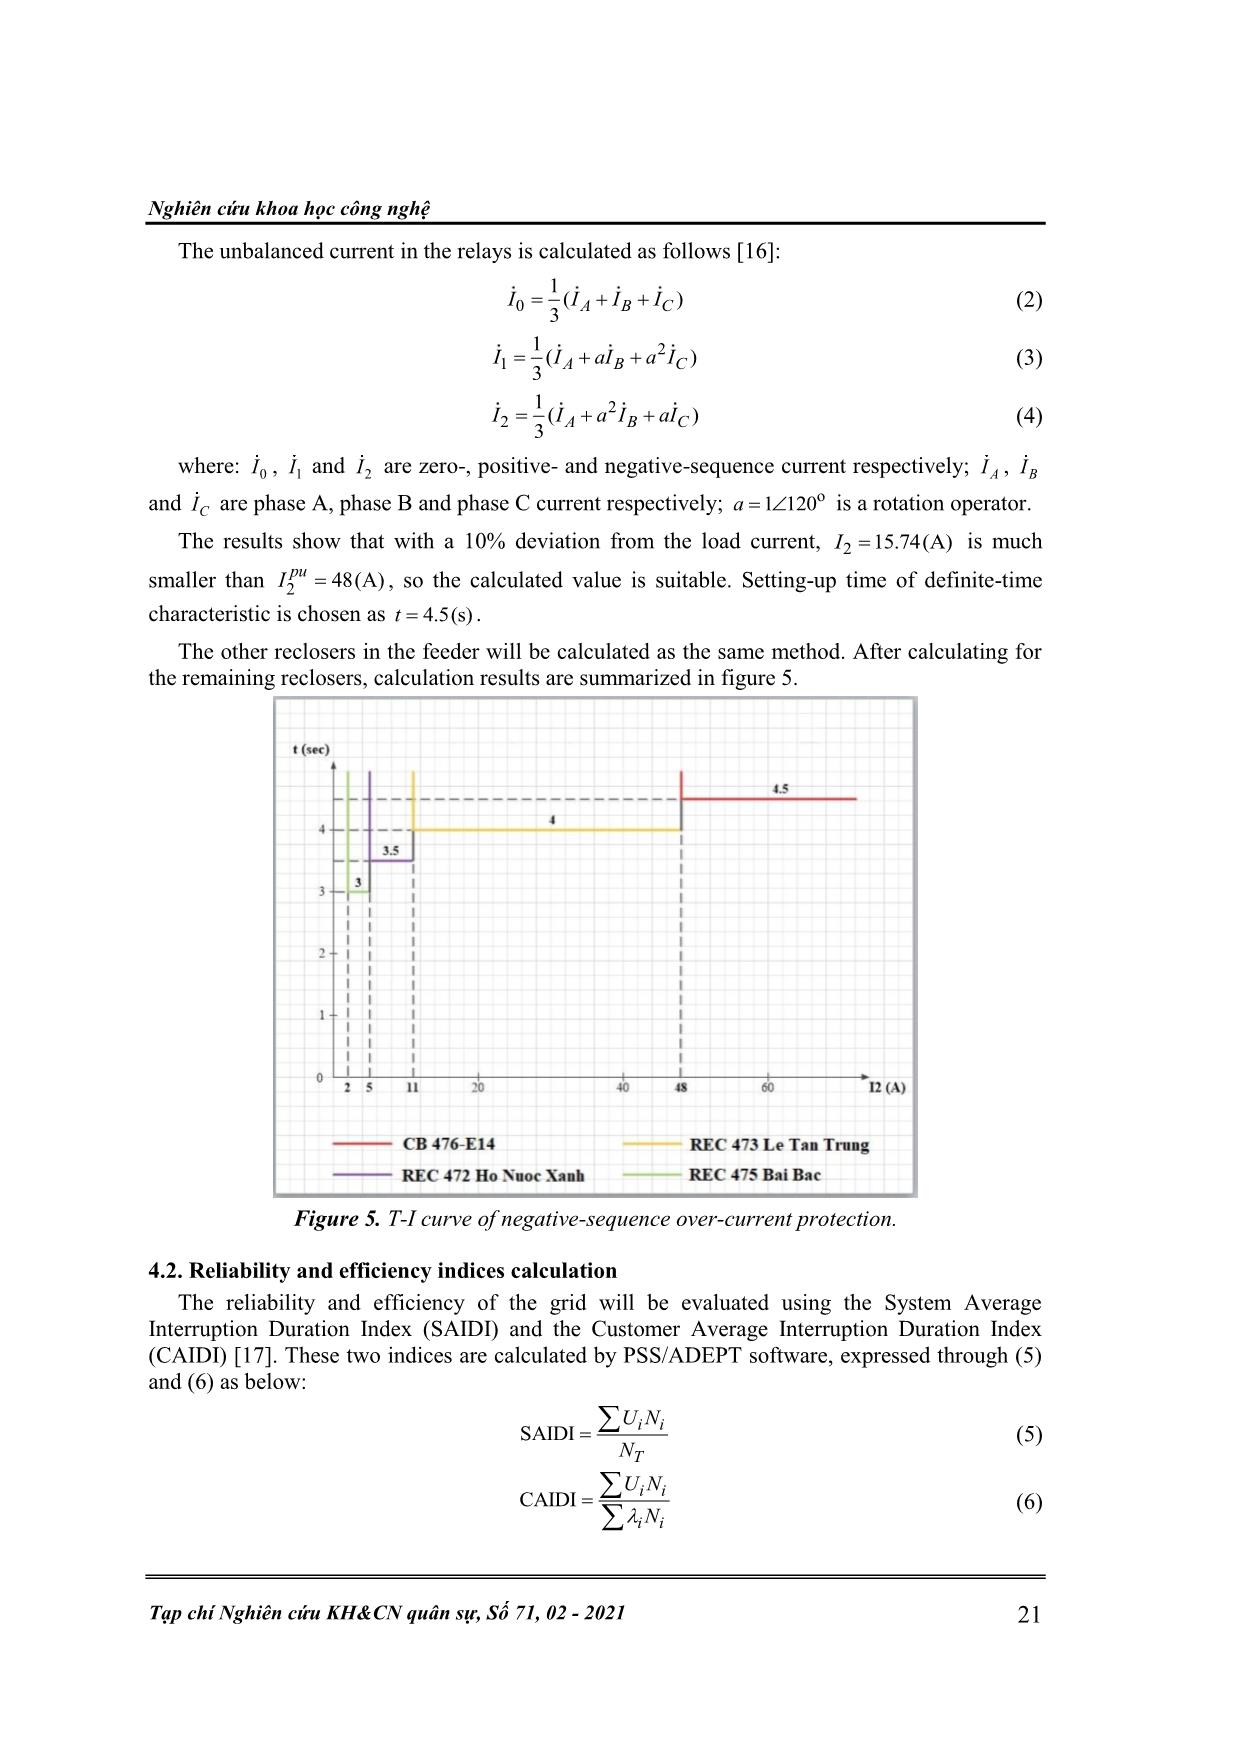
ion. Creating RTU: RTUs in Survalent corresponds to physical devices containing the actual data variables. Each RTU here represents an element on the actual grid connected directly to the Communication Line. After setting process in STC Explorer, the single-line diagram of the power system can be initialized in figure 1. Figure 1. Single-line diagram of a power grid in Survalent. 2.2. Google Earth Google Earth is a popular, open-source global geographic simulation program developed by Google. Google Earth is not a GIS with extensive analysis capabilities of ArcGIS or MapInfo [13-15], however it is easier to use and access than other software packages. This software is suitable for building transmission lines’ map in a city. 2.3. EVNCPC TTHT Figure 2. Interface of EVNCPC TTHT software. EVNCPC TTHT is a software application collecting, looking up, editing and adding scene information. The interface of the software is shown in figure 2. The software EVNCPC TTHT can create communication channels with other sub-software to collect the following information: Nghiên cứu khoa học công nghệ Tạp chí Nghiên cứu KH&CN quân sự, Số 71, 02 - 2021 19 PMIS software: Information of utility poles, lines and devices on the power grid. CMIS software: Information of customers and measurement. INCEU software: Information of electricity trading and meters’ data via radio waves. Spider-GIS software: Informing customers about equipment information, meters’ indicators and measurement points. Cable monitoring application: Information and figures of cables. 3. BUILDING POWER GRID DIAGRAM ON WEB MAPPING 3.1. Data Import Process from EVNCPC TTHT to Google Earth First of all, the standardization and synchronization of the data must be carried out before integrating or embedding a software into another platform. Information of devices and utility poles from EVNCPC TTHT will be exported in popular data management file formats, typically Excel. Collected data from the Excel file will be standardized according to the requirements shown in table 1. After that, the standardized data will be converted to “.kml” file format and included in Google Earth (coordinates, name, description and line characteristics). Furthermore, operators can edit the position of lines, poles in reality. Table 1. Requirement of standardized data from Excel integrated into Google Earth. Column Name in Excel Function description Latitude Latitude of the pole in the WGS 84 coordinate system. Longitude Longitude of the pole in the WGS 84 coordinate system. Name Name of the pole displayed on Google Earth. Description Pole information displayed in the Google Earth. Icon Icon of utility poles. Icon Scale The scale of the icon displayed on Google Earth. IconAltitude Altitude of the icon. IconLineColor Color of the icon. HideNameUntilMouseOver Display options when the mouse on the icon. LineStringColor Color of the power lines. 3.2. Solution of Combinating Survalent Software and Google Earth Figure 3. Diagram of a feeder in the grid when integrating Google Earth into Survalent. Kỹ thuật điều khiển & Điện tử 20 N. H. Nhan, T. T. Vinh, D. M. Quan, “Improving operational efficiency DaNang study case.” In this section, the data will be send to the database at the Control Center for further processing. In Survalent's HMI SmartVU, variable attributes are exploited for data configuration and building PMacro fields linked with each device. Then, the PMacro icon containing the link will be placed at the previously created Google Earth file path corresponding to the location of the device on the line. The information about location, status of the device will be provided when click on PMacro icon. At the end, the diagram of the grid can be displayed and adjusted on Google Earth platform as shown in figure 3. 4. EVALUATION OF POWER SYSTEM OPERATIONS WITH THE INTEGRATION OF GEOGRAPHIC MAP 4.1. Calculation of negative sequence over-current protection function (F46N) In this section, the authors have researched on the negative sequence over-current protection problem to a feeder of the 22kV DaNang distribution grid shown in figure 4. The pick-up current setting for the SEL-751 relay on circuit breaker 476-E14 is calculated as follows: max 2 0.08pu pu cs I I k k (1) where: maxI is maximum load current, puk is pick-up coefficient, csk is current setting coefficient. Circuit Breaker 476-E14 Recloser 473 Le Tan Trung Recloser 472 Ho Nuoc Xanh Recloser 475 Bai Bac An Don 457A 109A 45A 20A Figure 4. Diagram of feeder 476-E14. The parameters chosen for calculating: max 457(A)I , 1.2puk , 0.98csk . Thus, the relay pick-up current will be: 2 0.08 457 1.2 44.7(A) 0.98 pu I The ratio of connected current transformer is selected by 600/1. Consequently, the value of secondary current is: 44.7/600 = 0.0745 (A). The actual value is set to 0.08A (due to step value is 0.01-0.02). Accordingly, the pick-up current value is recalculated as: 2 0.08 600 48(A) pu I Checking the sensitivity of the relay: max 2 0.5 0.5 457 4.76 1.2 48 sensitivity s I k I (satisfied sensitivity condition) In case of the unbalanced load, with the 10% deviation of load current, parameters are given in table 2. Table 2. Parameters of 10% unbalanced load current. Ia Ib Ic I0 I2 I1 Current (A) 457 458 410.3 15.74 15.74 441.77 Phase ( o ) 0 -120 120 -61.05 61.05 0.00 Nghiên cứu khoa học công nghệ Tạp chí Nghiên cứu KH&CN quân sự, Số 71, 02 - 2021 21 The unbalanced current in the relays is calculated as follows [16]: 0 1 ( ) 3 A B CI I I I (2) 2 1 1 ( ) 3 A B CI I aI a I (3) 2 2 1 ( ) 3 A B CI I a I aI (4) where: 0I , 1I and 2I are zero-, positive- and negative-sequence current respectively; AI , BI and CI are phase A, phase B and phase C current respectively; o1 120a is a rotation operator. The results show that with a 10% deviation from the load current, 2 15.74(A)I is much smaller than 2 48(A) pu I , so the calculated value is suitable. Setting-up time of definite-time characteristic is chosen as 4.5(s)t . The other reclosers in the feeder will be calculated as the same method. After calculating for the remaining reclosers, calculation results are summarized in figure 5. Figure 5. T-I curve of negative-sequence over-current protection. 4.2. Reliability and efficiency indices calculation The reliability and efficiency of the grid will be evaluated using the System Average Interruption Duration Index (SAIDI) and the Customer Average Interruption Duration Index (CAIDI) [17]. These two indices are calculated by PSS/ADEPT software, expressed through (5) and (6) as below: SAIDI i i T U N N (5) CAIDI i i i i U N N (6) Kỹ thuật điều khiển & Điện tử 22 N. H. Nhan, T. T. Vinh, D. M. Quan, “Improving operational efficiency DaNang study case.” where: iU is the annual outage time at location i , iN is the number of customers at location i , TN is the total number of customers served, i is the failure rate of devices. Based on the information collected from the database of SCADA server, the parameters i and iU will be calculated and statistics for each location i according to (7) and (8): Number of faults Totalnumber of devices i (7) i i iU r (8) where: ir is the average outage time in each power failure for each customer. Based on the figures of failure intensity and the average repair time, the results of indices calculation are summarized in table 3. Table 3. Comparison of grid reliability before and after the solution. Area Name No. of customers SAIDI (minute/customer/year) Before After Reduction ratio (%) 473 Le Tan Trung 14213 507 330 34.9% 472 Ho Nuoc Xanh 4384 335 198 40.8% 475 Bai Bac 3954 301 176 41.5% Area Name No. of customers CAIDI (minute/customer/year) Before After Reduction ratio (%) 473 Le Tan Trung 14213 34.8 22.2 36.2% 472 Ho Nuoc Xanh 4384 44.07 25.8 41.4% 475 Bai Bac 3954 47.24 27.3 42.2% Without this solution, the indices SAIDI and CAIDI would be higher every year, which leads to the decrease of operational efficiency and profit. However, when the proposed solution is applied, the calculation results of SAIDI and CAIDI are much lower and the reduction rate is very high, from 34% to 42% as shown in table 3. 5. CONCLUSION The solution of combining geographic maps and SCADA systems provided power control centers with an intuitive and useful tool, which will meet the needs of determining specific locations, line directions, equipment on geographic map platform. SAIDI and CAIDI technical indices in the grid have been calculated to show the efficiency of the solution. From there, improving the operational efficiency of the power grid and grid reliability is really practicable, especially in the process of building smart power grids. In addition, this solution can improve customer care service in power companies and at the same time, applied in the training of new and junior dispatchers. Acknowledgment: This research is funded by Vietnam National Foundation for Science and Technology Development (NAFOSTED) under grant number 102.02-2020.07. APPENDIX: LIST OF ABBREVIATIONS EMS Energy Management System SCADA Supervisory Control And Data Acquisition GIS Geographic Information System ADMS Advanced Distribution Management Systems Nghiên cứu khoa học công nghệ Tạp chí Nghiên cứu KH&CN quân sự, Số 71, 02 - 2021 23 STC StationCentral HMI Human-Machine Interface RTU Remote Terminal Units PMIS Power network Management Information System CMIS Customer Management Information System INCEU IN Control of Electricity User LBS Load Break Switch SAIDI System Average Interruption Duration Index CAIDI Customer Average Interruption Duration Index WGS 84 World Geodetic System 1984 REFERENCES [1]. Duong, M. Q., H. H. Nguyen, T. Le, and Marco Mussetta, “New Planning for the 500kV Vietnamese Grid with High Penetration of Renewable Energy Sources”, 13th IEEE PowerTech, Milano, Italy, (2019). [2]. Priya, G.K. and Bandyopadhyay, S., “Multi-objective pinch analysis for power system planning”, Applied Energy, Vol. 202, pp. 335-347, 2017. [3]. Bazilian, M. and Chattopadhyay, D., “Considering power system planning in fragile and conflict states”, Energy for sustainable development, Vol. 32, pp. 110-120, (2016). [4]. Dao, P.B., Staszewski, W.J., Barszcz, T. and Uhl, T., “Condition monitoring and fault detection in wind turbines based on cointegration analysis of SCADA data”, Renewable Energy, Vol. 116, pp.107-122, (2018). [5]. Keshk, M., Moustafa, N., Sitnikova, E. and Creech, G., “Privacy preservation intrusion detection technique for SCADA systems”, 2017 Military Communications and Information Systems Conference (MilCIS), Canberra, Australia, November 14-16, (2017). [6]. M. M. Hasan and H. T. Mouftah, “Optimization of Trust Node Assignment for Securing Routes in Smart Grid SCADA Networks”, IEEE Systems Journal, Vol. 13, No. 2, pp. 1505-1513, (2019). [7]. R. Faranda, L. Gozzi, A. Bosisio and K. Akkala, “SCADA system for optimization of energy exchange with the BESS in a residential case”, 2019 IEEE International Conference on Environment and Electrical Engineering and 2019 IEEE Industrial and Commercial Power Systems Europe (EEEIC / I&CPS Europe), Genova, Italy, (2019). [8]. Rathnayaka, R. M. J., and K. T. M. U. Hemapala, “Developing of scalable SCADA in view of acquiring multi-protocol smart grid devices”, 2nd International Conference on Advances in Electrical, Electronics, Information, Communication and Bio-Informatics (AEEICB), Chennai, India, (2016). [9]. Oks, Sascha Julian, Albrecht Fritzsche, and Kathrin M. Möslein, “An application map for industrial cyber-physical systems”, Industrial internet of things, Springer, Cham, pp. 21-46, (2017). [10]. Lazarou, S., Vita, V., Karampelas, P. and Ekonomou, L., “A power system simulation platform for planning and evaluating distributed generation systems based on GIS”, Energy Systems, Vol. 4, No. 4, pp. 379-391, (2013). [11]. Ashkezari, A.D., Hosseinzadeh, N., Chebli, A. and Albadi, M., “Development of an enterprise Geographic Information System (GIS) integrated with smart grid”, Sustainable Energy, Grids and Networks, Vol. 14, pp. 25-34, (2018). [12]. Radhakrishnan, K.K., Moirangthem, J., Panda, S.K. and Amaratunga, G., “GIS integrated automation of a near real-time power-flow service for electrical grids”, IEEE Transactions on Industry Applications, Vol. 54, No. 6, pp. 5661-5670, (2018). [13]. Daniel, Larry, Paula Loree, and Angela Whitener, “Inside MapInfo professional: the friendly user guide to MapInfo professional”, Cengage Learning, (2002). Kỹ thuật điều khiển & Điện tử 24 N. H. Nhan, T. T. Vinh, D. M. Quan, “Improving operational efficiency DaNang study case.” [14]. Trần Vinh Tịnh, Dương Minh Quân, “Nghiên cứu quản lý mạng lưới điện trung thế TP. Đà Nẵng bằng GIS”, Tạp chí Khoa học và Công nghệ - Đại học Đà Nẵng, (2009). [15]. Kennedy, Michael, “The Global Positioning System and ArcGIS”, CRC Press, (2009). [16]. Lê Kim Hùng, “Bảo vệ các phần tử chính trong hệ thống điện”, (2006). [17]. Arya, L.D., Choube, S.C. and Arya, R., “Differential evolution applied for reliability optimization of radial distribution systems”, International Journal of Electrical Power & Energy Systems, Vol. 33, No. 2, pp. 271-277, (2011). TÓM TẮT NÂNG CAO HIỆU QUẢ VẬN HÀNH CỦA HỆ THỐNG ĐIỆN VỚI GIẢI PHÁP TÍCH HỢP BẢN ĐỒ ĐỊA LÝ TRONG HỆ THỐNG SCADA CHO LƯỚI ĐIỆN THÀNH PHỐ ĐÀ NẴNG Sự phát triển không ngừng của công nghệ lưới điện thông minh ngày nay là nhu cầu thiết yếu để nâng cao hiệu quả vận hành của hệ thống điện. Các giải pháp công nghệ về hệ thống quản lý năng lượng (EMS), bao gồm Hệ thống Điều khiển giám sát và thu thập dữ liệu (SCADA) và Hệ thống Quản lý Phân phối (DMS), phải được phát triển liên tục về phạm vi ứng dụng và hiệu suất để đáp ứng các yêu cầu nêu trên. Bài báo đề xuất giải pháp tích hợp bản đồ địa lý Google Earth vào hệ thống SCADA trong vận hành hệ thống điện. Hiệu quả của giải pháp đề xuất được đánh giá thông qua phần mềm PSS/ADEPT. Kết quả cho thấy giải pháp đề xuất góp phần nâng cao độ tin cậy của lưới điện và nâng cao hiệu quả dịch vụ chăm sóc khách hàng cũng như đào tạo điều độ viên cơ sở. Từ khóa: Lưới điện thông minh, Hệ thống SCADA, Bản đồ địa lý, Độ tin cậy, Điều độ hệ thống điện. Received 26 th October 2020 Revised 06 th December 2020 Published 05 th February 2021 Author affiliations: 1 Da Nang Power Company, Ltd - Load Dispatch Division; 2 The University of Danang - University of Science and Technology. * Corresponding author: dmquan@dut.udn.vn .
File đính kèm:
 improving_operational_efficiency_of_grids_by_integrating_geo.pdf

