Factors affecting the revenue of the electric factory in immediate market and through contract for difference
ABSTRACT
This article investigates the factors affecting the revenue of the plant when paying through the
electricity market and contract for the difference such as the affection of power, contract price and the
factory’s offer price. The analysis has been applied to 14 network diagrams IEEE node, from which we can
see the impact and the role of contracting for differences in avoiding price risks in the electricity market.
Through the analysis process, the article also suggests the way to work properly so that the factory can
achieve the highest revenue.
Keywords: Contract for differences, electric power system, electricity market, location marginal
price, the profit in electricity market.
TÓM TẮT
Các yếu tố ảnh hưởng tới doanh thu của nhà máy điện
trong thị trường điện giao ngay và thông qua hợp đồng sai khác
Bài báo này nghiên cứu các yếu tố ảnh hưởng tới doanh thu của nhà máy khi thanh toán qua thị
trường điện giao ngay và qua hợp đồng sai khác như ảnh hưởng của công suất và giá hợp đồng, ảnh hưởng
của bảng giá chào của nhà máy. Các tính toán phân tích được áp dụng cho sơ đồ lưới IEEE 14 nút, từ đó
thấy được ảnh hưởng và vai trò của việc tham gia hợp đồng sai khác đối với việc tránh rủi ro giá cả trong
thị trường điện, và thông qua quá trình phân tích bài báo cũng đề xuất cách thức vận hành hợp lý để nhà
máy đạt doanh thu cao nhất.
Từ khóa: Hợp đồng sai khác, hệ thống điện, thị trường điện, giá biên nút, doanh thu trong thị
trường điện.
Trang 1
Trang 2
Trang 3
Trang 4
Trang 5
Trang 6
Trang 7
Trang 8
Trang 9

Trang 10
Tóm tắt nội dung tài liệu: Factors affecting the revenue of the electric factory in immediate market and through contract for difference
e annual variable price is adjusted to the base year variable
price, effi ciency loss factor, base fuel price, fuel price at the time of payment.The monthly change
price of the hydropower plants is adjusted based on the annual electricity price, base year price,
environmental fee and royalty at the time of payment, total value of principal, foreign currency
loans, the power output is many years at the factory’s power point. Here is a detailed calculation
method of the relevant quantities:
a. The annual contract output: The annual contract output is determined on the basis of
the yearly output of the annual plan, average annual output and contract yield. They are determined
through the following steps:
 + Plan the next year’s power grid system according to the binding scheduling method.
 + Calculate the annual output of the power plant according to the following formula [1]:
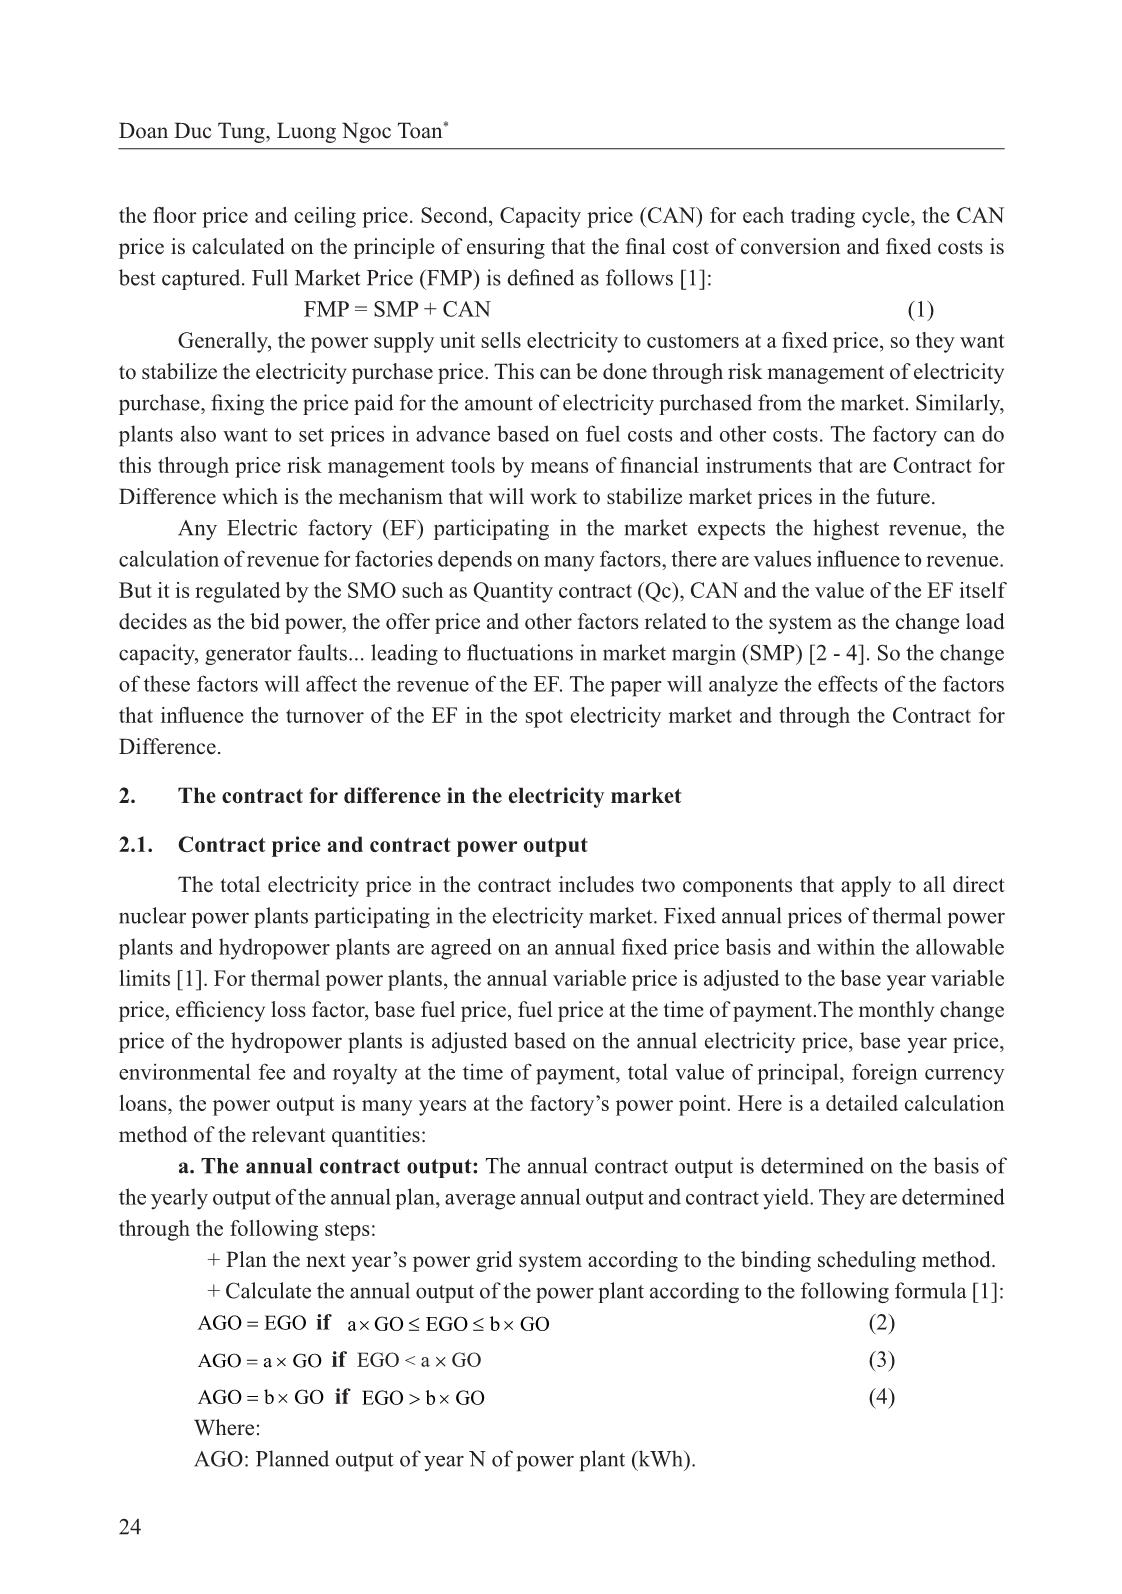
 AGO EGO= if (2)
 AGO a GO= × if EGO < a × GO (3)
 AGO b GO= × if (4)
 Where:
 AGO: Planned output of year N of power plant (kWh).
a GO EGO b GO× ≤ ≤ ×
EGO b GO> ×
Doan Duc Tung, Luong Ngoc Toan*
25
 Tập 13, Số 1, 2019
EGO: The estimated output in year N of the power plant (kWh), determined from the
market simulation model in terms of the location of the measurement.
GO: Power yield agreement to calculate contract price (kWh).
a, b: Annual production adjustment coeffi cient shall be determined according to the
regulations on methods of determining electricity generation prices. The order and procedures for
the formulation and promulgation of power price brackets and the approval of power purchase
contracts.
Where a = 0.9; b = 1.1.
+ Calculate the annual output of the power plant [1]:
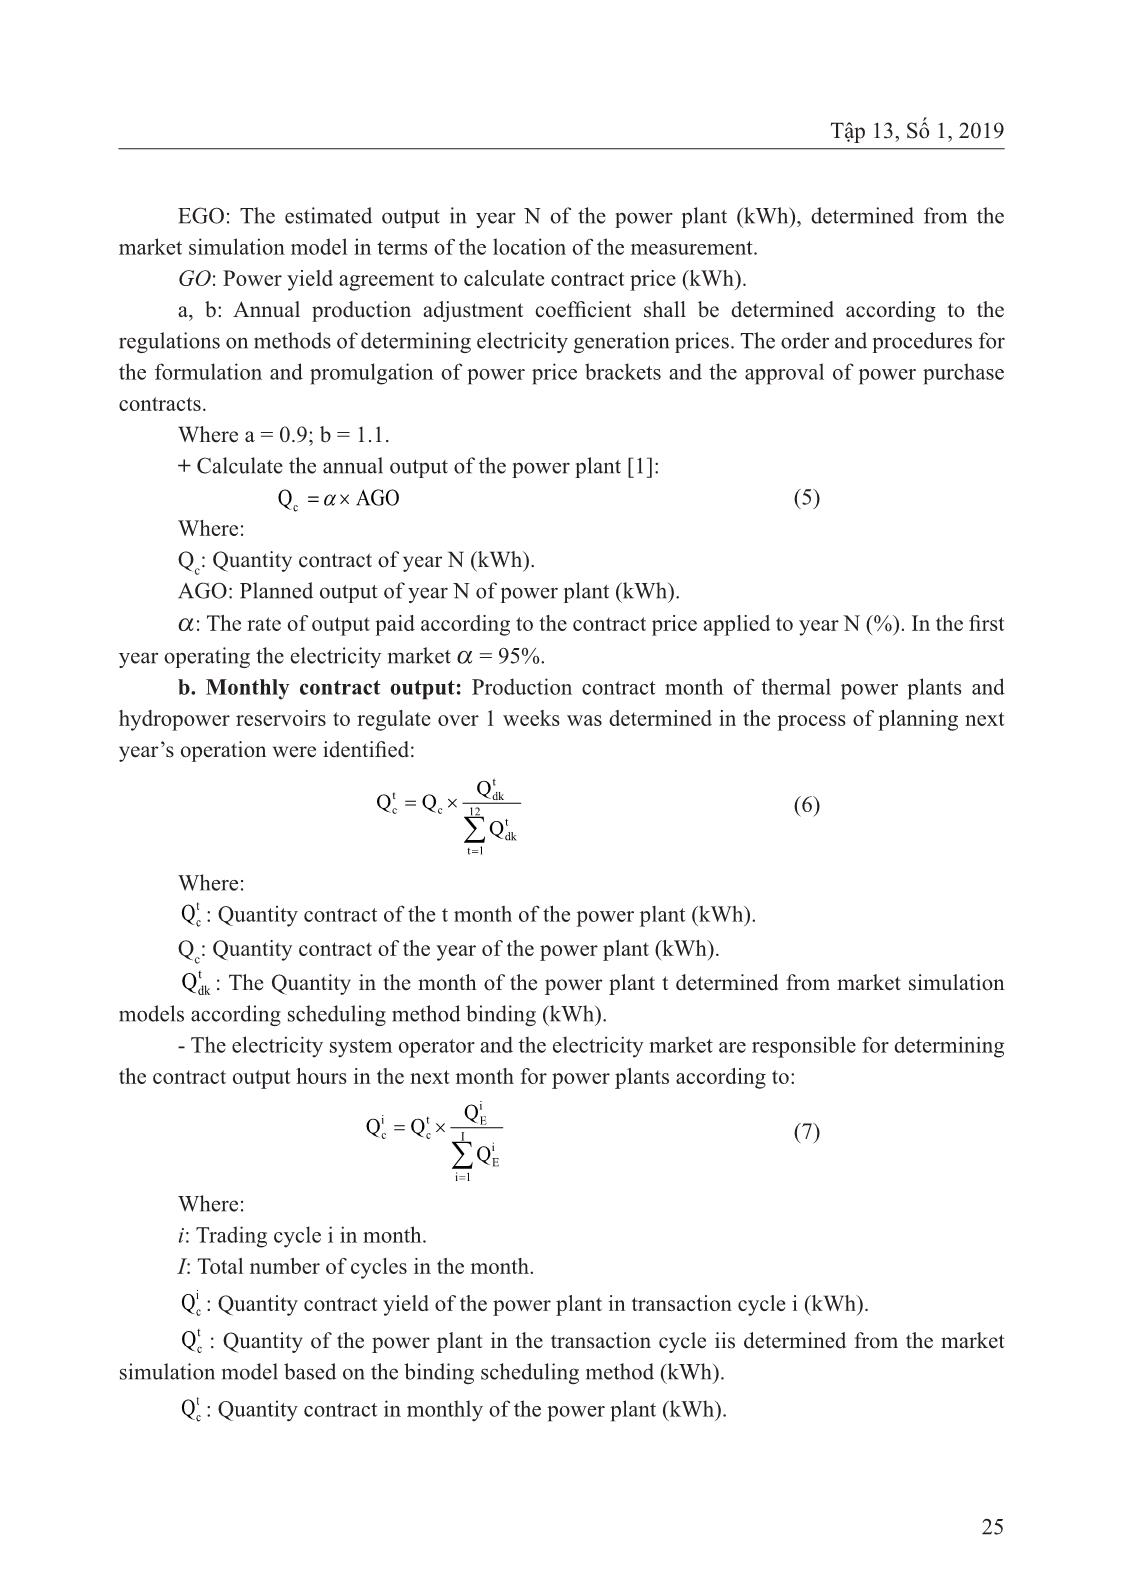
 (5)
Where:
Qc: Quantity contract of year N (kWh).
AGO: Planned output of year N of power plant (kWh).
α: The rate of output paid according to the contract price applied to year N (%). In the fi rst
year operating the electricity market α = 95%.
b. Monthly contract output: Production contract month of thermal power plants and
hydropower reservoirs to regulate over 1 weeks was determined in the process of planning next
year’s operation were identifi ed:
 (6)
Where:
t
cQ : Quantity contract of the t month of the power plant (kWh).
Qc: Quantity contract of the year of the power plant (kWh).
t
dkQ : The Quantity in the month of the power plant t determined from market simulation
models according scheduling method binding (kWh).
- The electricity system operator and the electricity market are responsible for determining
the contract output hours in the next month for power plants according to:
(7)
Where:
i: Trading cycle i in month.
I: Total number of cycles in the month.
i
cQ : Quantity contract yield of the power plant in transaction cycle i (kWh).
t
cQ : Quantity of the power plant in the transaction cycle iis determined from the market
simulation model based on the binding scheduling method (kWh).
t
cQ : Quantity contract in monthly of the power plant (kWh).
cQ AGOα= ×
t
t dk
c c 12
t
dk
t 1
Q
Q Q
Q
=
= ×
∑
i
i t E
c c I
i
E
i 1
Q
Q Q
Q
=
= ×
∑
26
2.2. Payment under the contract of sale and purchase of electricity in the contract for
difference
Based on the market electricity prices and market capacity announced by the operator of the
electricity system and the electricity market, the electricity generating unit shall be responsible
for calculating the payment under the different types of electricity purchase contracts in the
billing cycle:
+ Revenue from electricity contract
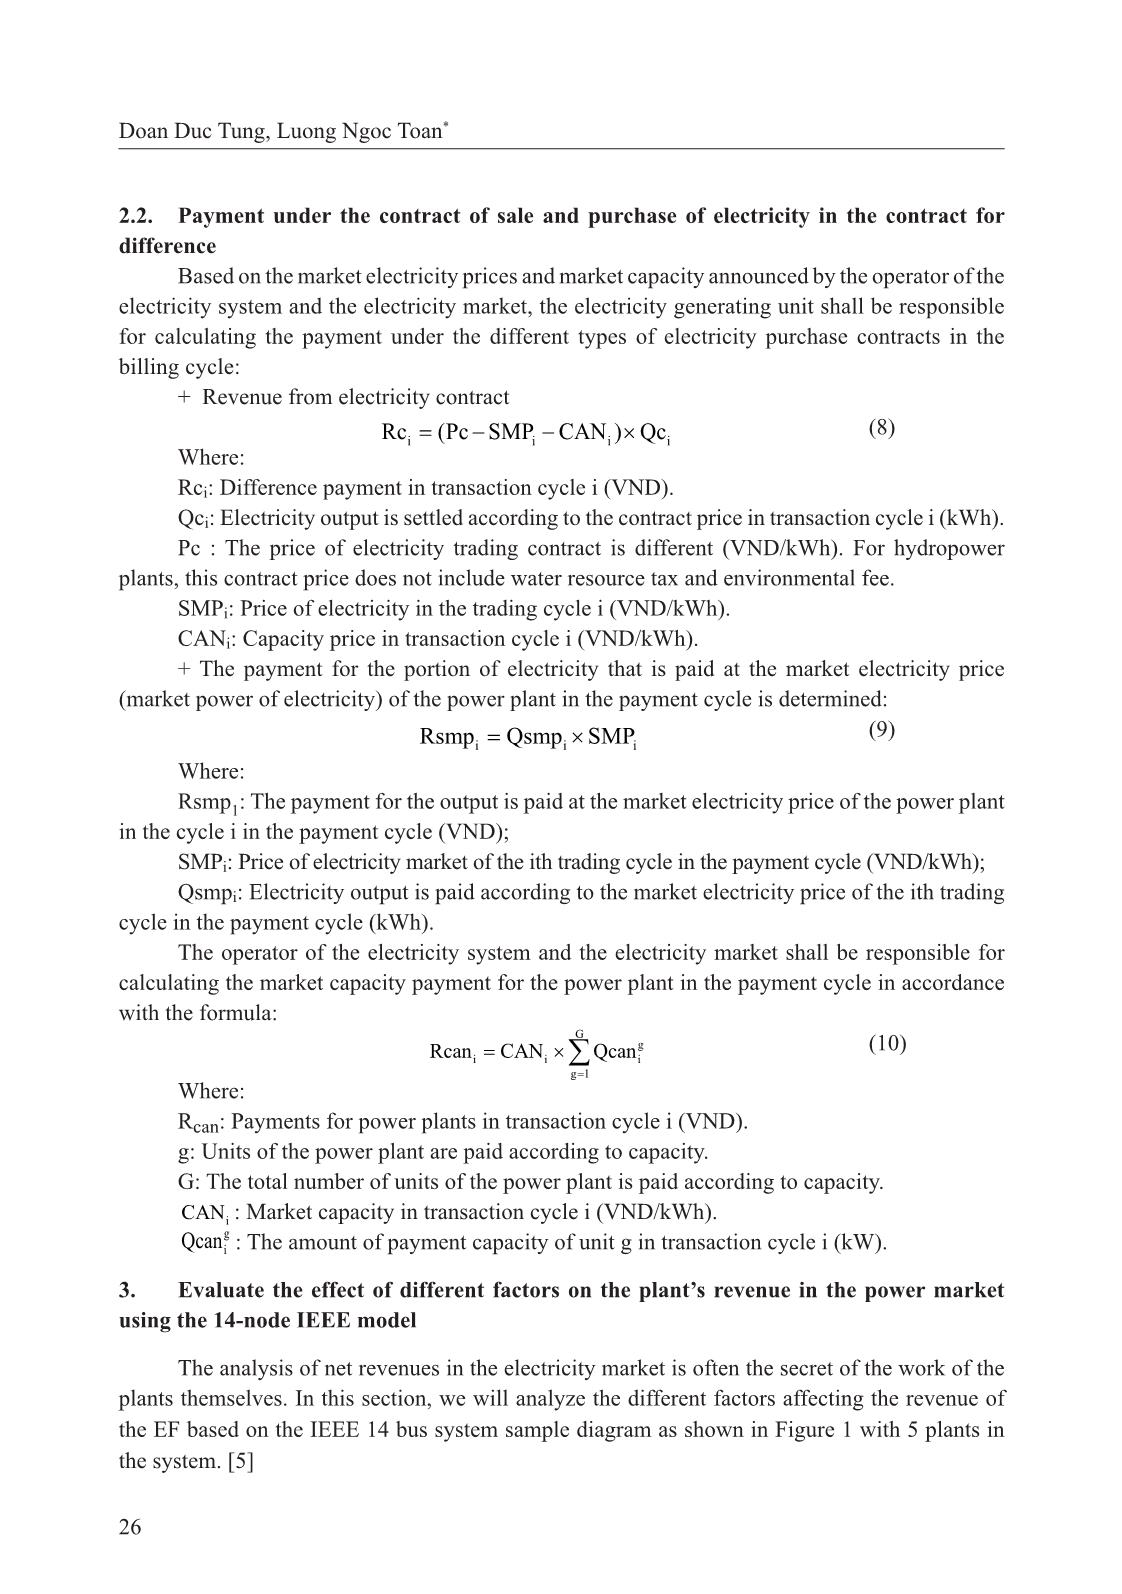
 (8)
Where:
Rci: Difference payment in transaction cycle i (VND).
Qci: Electricity output is settled according to the contract price in transaction cycle i (kWh).
P c : The price of electricity trading contract is different (VND/kWh). For hydropower
plants, this contract price does not include water resource tax and environmental fee.
SMPi: Price of electricity in the trading cycle i (VND/kWh).
CANi: Capacity price in transaction cycle i (VND/kWh).
+ The payment for the portion of electricity that is paid at the market electricity price
(market power of electricity) of the power plant in the payment cycle is determined:
 (9)
Where:
Rsmp1: The payment for the output is paid at the market electricity price of the power plant
in the cycle i in the payment cycle (VND);
SMPi: Price of electricity market of the ith trading cycle in the payment cycle (VND/kWh);
Qsmpi: Electricity output is paid according to the market electricity price of the ith trading
cycle in the payment cycle (kWh).
The operator of the electricity system and the electricity market shall be responsible for
calculating the market capacity payment for the power plant in the payment cycle in accordance
with the formula:
 (10)
Where:
Rcan: Payments for power plants in transaction cycle i (VND).
g: Units of the power plant are paid according to capacity.
G: The total number of units of the power plant is paid according to capacity.
iCAN : Market capacity in transaction cycle i (VND/kWh).
g
iQcan : The amount of payment capacity of unit g in transaction cycle i (kW).
3. Evaluate the effect of different factors on the plant’s revenue in the power market
using the 14-node IEEE model
The analysis of net revenues in the electricity market is often the secret of the work of the
plants themselves. In this section, we will analyze the different factors affecting the revenue of
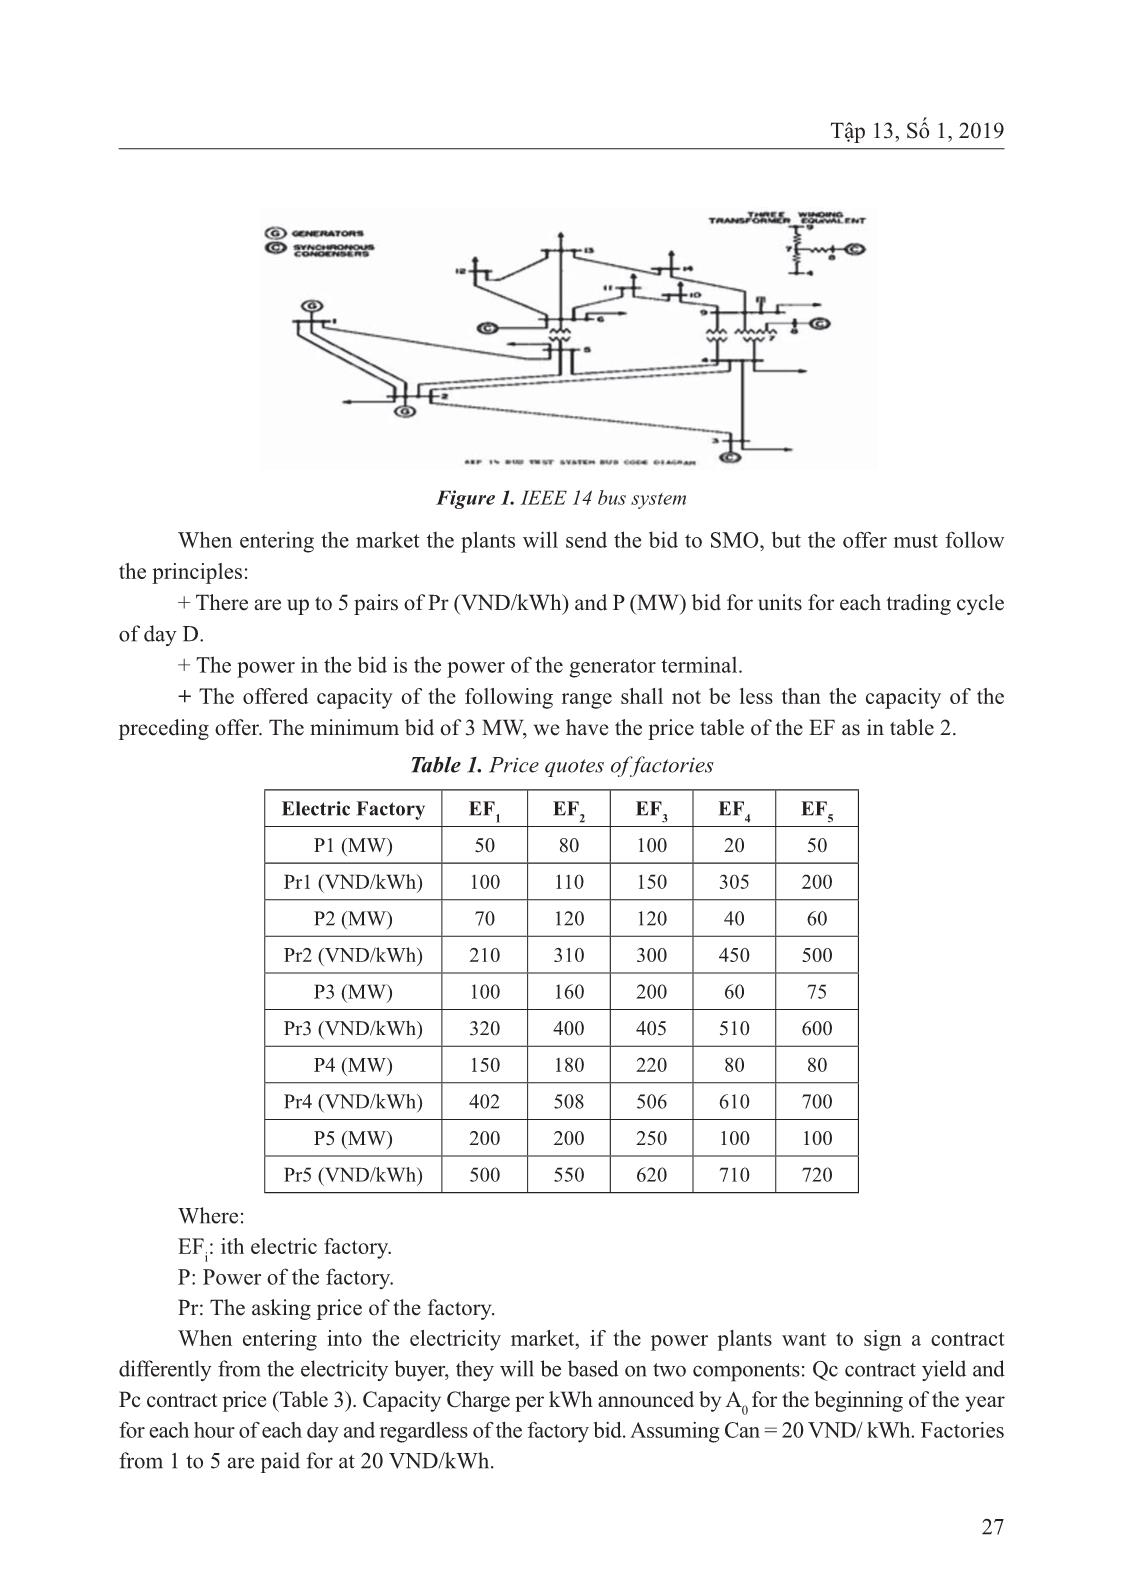
the EF based on the IEEE 14 bus system sample diagram as shown in Figure 1 with 5 plants in
the system. [5]
i i i iRc (Pc SMP CAN ) Qc= − − ×
i i iRsmp Qsmp SMP= ×
G
g
i i i
g 1
Rcan CAN Qcan
=
= ×∑
Doan Duc Tung, Luong Ngoc Toan*
27
 Tập 13, Số 1, 2019
Figure 1. IEEE 14 bus system
When entering the market the plants will send the bid to SMO, but the offer must follow
the principles:
+ There are up to 5 pairs of Pr (VND/kWh) and P (MW) bid for units for each trading cycle
of day D.
+ The power in the bid is the power of the generator terminal.
+ The offered capacity of the following range shall not be less than the capacity of the
preceding offer. The minimum bid of 3 MW, we have the price table of the EF as in table 2.
Table 1. Price quotes of factories
Electric Factory EF1 EF2 EF3 EF4 EF5
P1 (MW) 50 80 100 20 50
Pr1 (VND/kWh) 100 110 150 305 200
P2 (MW) 70 120 120 40 60
Pr2 (VND/kWh) 210 310 300 450 500
P3 (MW) 100 160 200 60 75
Pr3 (VND/kWh) 320 400 405 510 600
P4 (MW) 150 180 220 80 80
Pr4 (VND/kWh) 402 508 506 610 700
P5 (MW) 200 200 250 100 100
Pr5 (VND/kWh) 500 550 620 710 720
Where:
EFi: ith electric factory.
P: Power of the factory.
Pr: The asking price of the factory.
When entering into the electricity market, if the power plants want to sign a contract
differently from the electricity buyer, they will be based on two components: Qc contract yield and
Pc contract price (Table 3). Capacity Charge per kWh announced by A0 for the beginning of the year
for each hour of each day and regardless of the factory bid. Assuming Can = 20 VND/ kWh. Factories
from 1 to 5 are paid for at 20 VND/kWh.
28
Table 2. CfD Contract Input Data
Electric Factory
Allocate the
output CfD (Qc)
 (MW)
CfD price(Pc )
(VND/KWh)
EF1 200 300
EF2 250 400
EF3 200 200
EF4 10 450
EF5 40 180
3.1. Effect of change of load on plant revenue
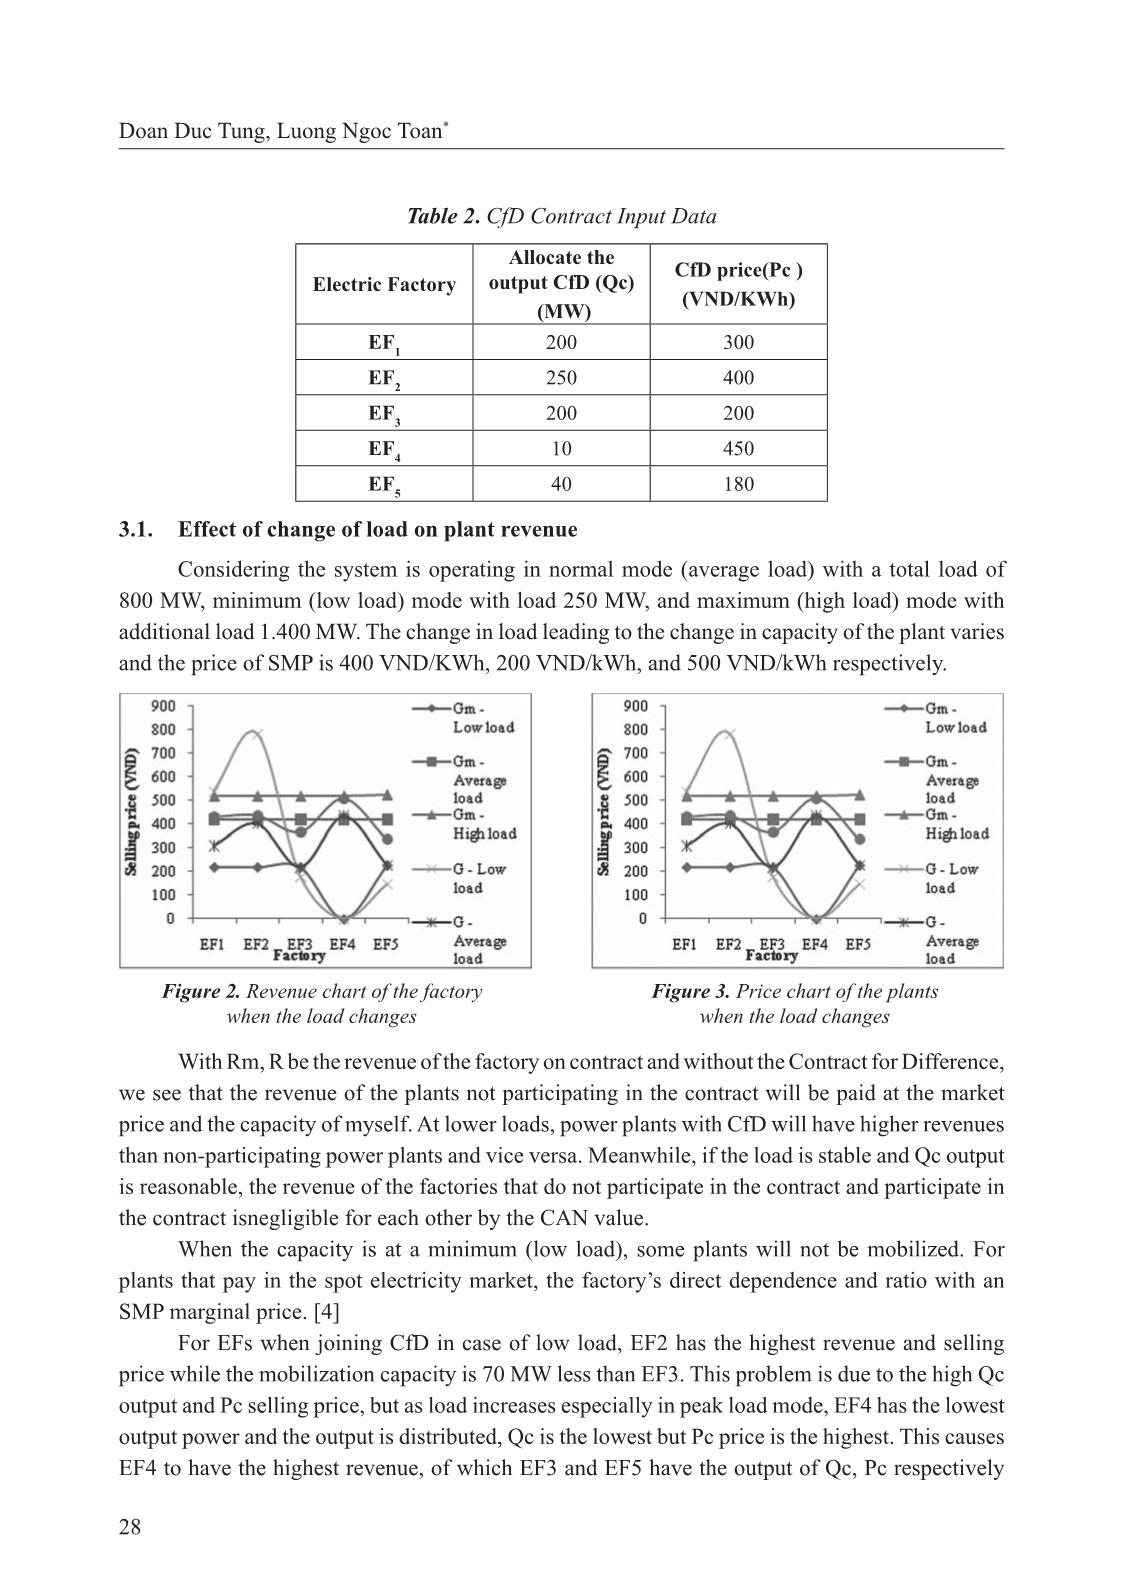
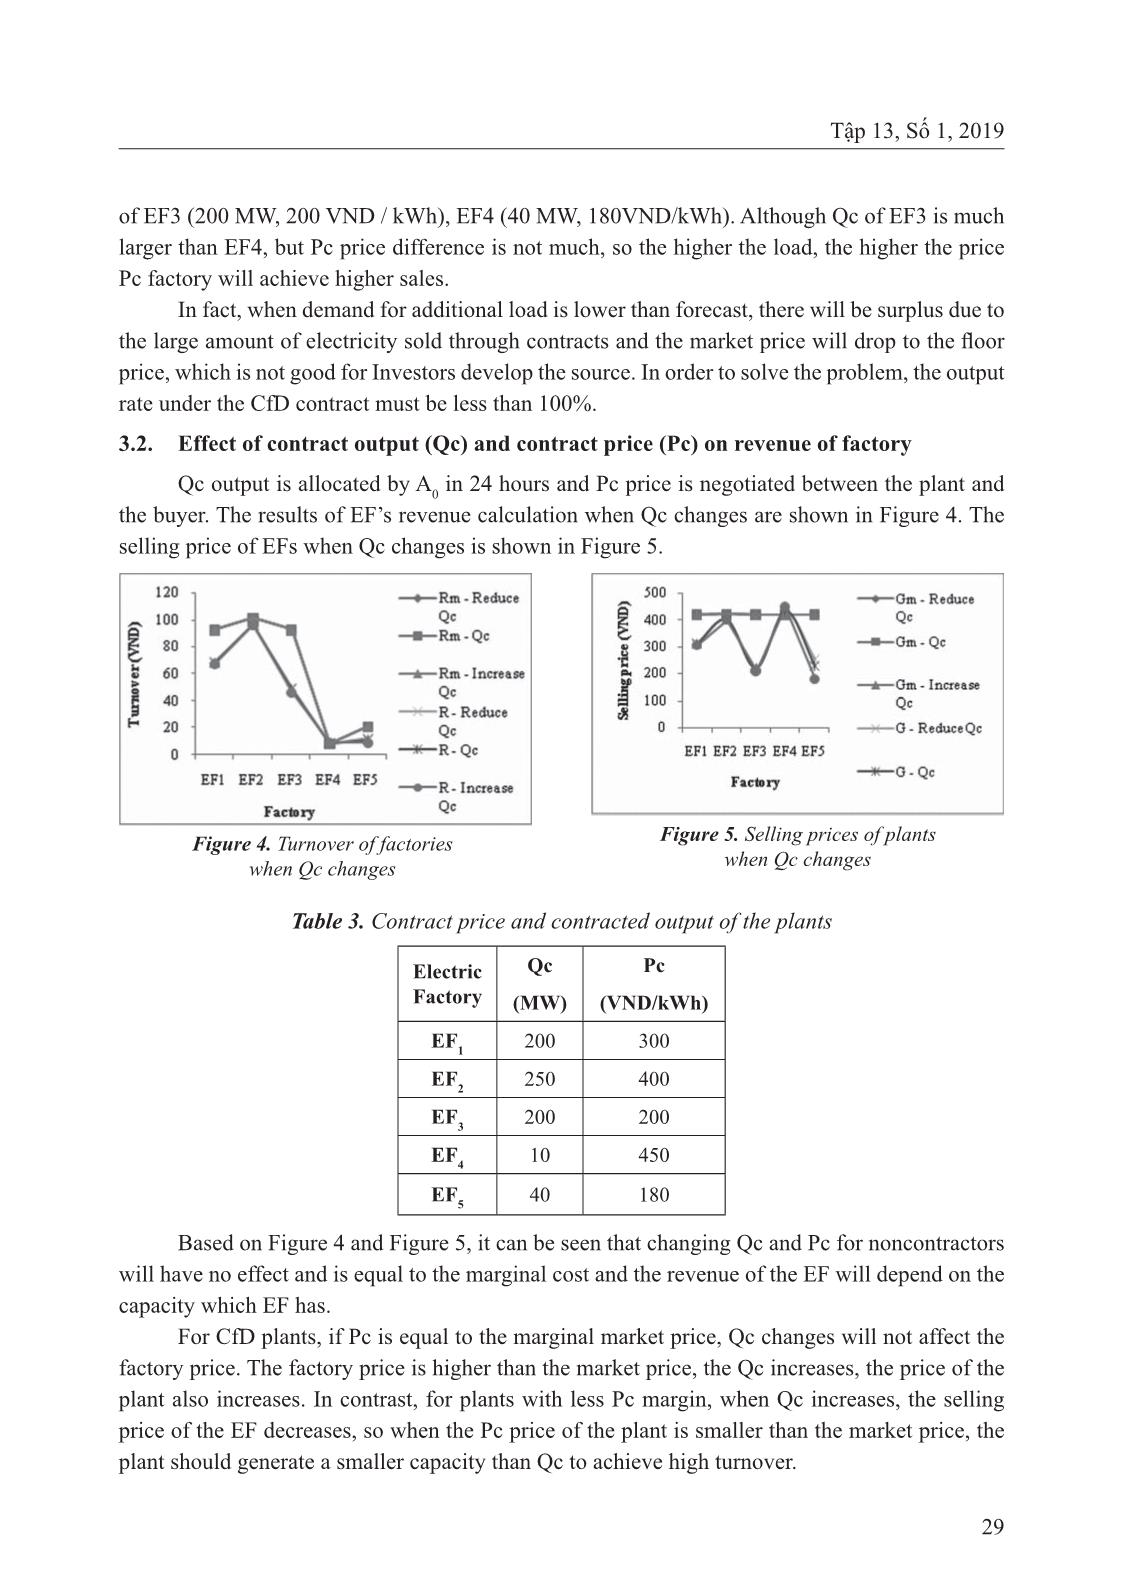
Considering the system is operating in normal mode (average load) with a total load of
800 MW, minimum (low load) mode with load 250 MW, and maximum (high load) mode with
additional load 1.400 MW. The change in load leading to the change in capacity of the plant varies
and the price of SMP is 400 VND/KWh, 200 VND/kWh, and 500 VND/kWh respectively.
With Rm, R be the revenue of the factory on contract and without the Contract for Difference,
we see that the revenue of the plants not participating in the contract will be paid at the market
price and the capacity of myself. At lower loads, power plants with CfD will have higher revenues
than non-participating power plants and vice versa. Meanwhile, if the load is stable and Qc output
is reasonable, the revenue of the factories that do not participate in the contract and participate in
the contract isnegligible for each other by the CAN value.
When the capacity is at a minimum (low load), some plants will not be mobilized. For
plants that pay in the spot electricity market, the factory’s direct dependence and ratio with an
SMP marginal price. [4]
For EFs when joining CfD in case of low load, EF2 has the highest revenue and selling
price while the mobilization capacity is 70 MW less than EF3. This problem is due to the high Qc
output and Pc selling price, but as load increases especially in peak load mode, EF4 has the lowest
output power and the output is distributed, Qc is the lowest but Pc price is the highest. This causes
EF4 to have the highest revenue, of which EF3 and EF5 have the output of Qc, Pc respectively
Figure 2. Revenue chart of the factory
when the load changes
Figure 3. Price chart of the plants
when the load changes
Doan Duc Tung, Luong Ngoc Toan*
29
 Tập 13, Số 1, 2019
of EF3 (200 MW, 200 VND / kWh), EF4 (40 MW, 180VND/kWh). Although Qc of EF3 is much
larger than EF4, but Pc price difference is not much, so the higher the load, the higher the price
Pc factory will achieve higher sales.
In fact, when demand for additional load is lower than forecast, there will be surplus due to
the large amount of electricity sold through contracts and the market price will drop to the fl oor
price, which is not good for Investors develop the source. In order to solve the problem, the output
rate under the CfD contract must be less than 100%.
3.2. Effect of contract output (Qc) and contract price (Pc) on revenue of factory
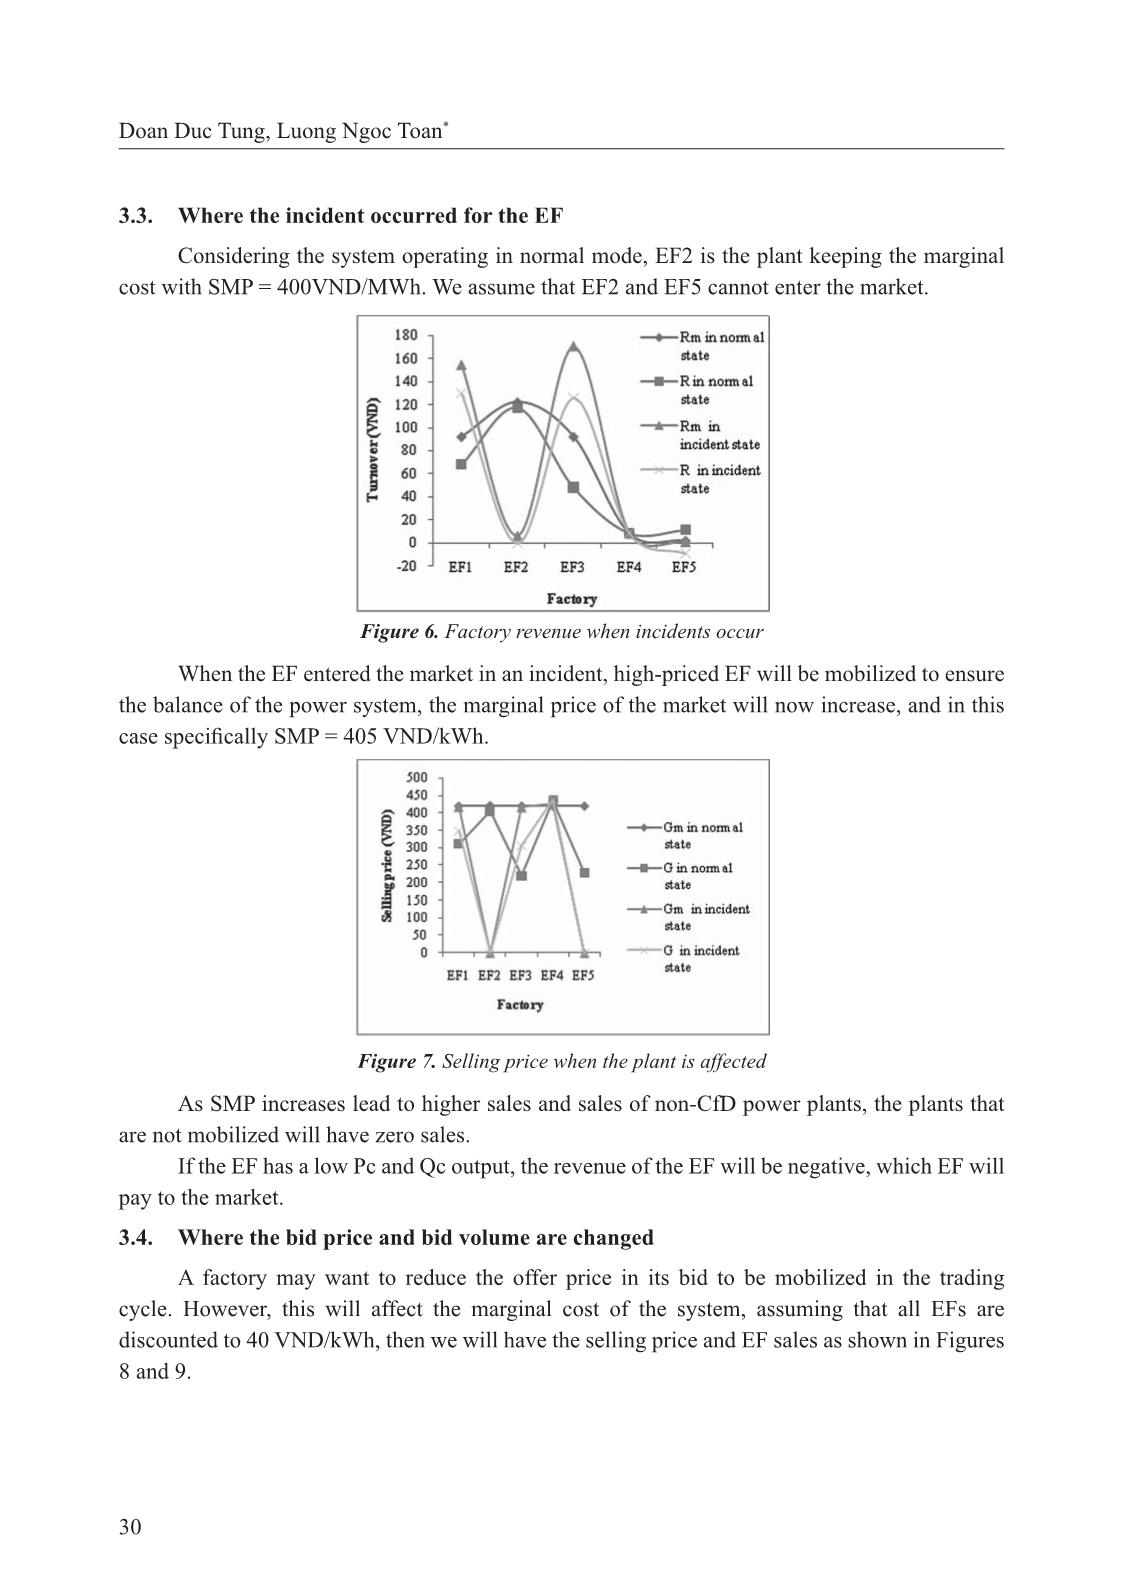
Qc output is allocated by A0 in 24 hours and Pc price is negotiated between the plant and
the buyer. The results of EF’s revenue calculation when Qc changes are shown in Figure 4. The
selling price of EFs when Qc changes is shown in Figure 5.
Table 3. Contract price and contracted output of the plants
Electric
Factory
Qc
(MW)
Pc
(VND/kWh)
EF1 200 300
EF2 250 400
EF3 200 200
EF4 10 450
EF5 40 180
Based on Figure 4 and Figure 5, it can be seen that changing Qc and Pc for noncontractors
will have no effect and is equal to the marginal cost and the revenue of the EF will depend on the
capacity which EF has.
For CfD plants, if Pc is equal to the marginal market price, Qc changes will not affect the
factory price. The factory price is higher than the market price, the Qc increases, the price of the
plant also increases. In contrast, for plants with less Pc margin, when Qc increases, the selling
price of the EF decreases, so when the Pc price of the plant is smaller than the market price, the
plant should generate a smaller capacity than Qc to achieve high turnover.
Figure 4. Turnover of factories
when Qc changes
Figure 5. Selling prices of plants
when Qc changes
30
3.3. Where the incident occurred for the EF
Considering the system operating in normal mode, EF2 is the plant keeping the marginal
cost with SMP = 400VND/MWh. We assume that EF2 and EF5 cannot enter the market.
Figure 6. Factory revenue when incidents occur
When the EF entered the market in an incident, high-priced EF will be mobilized to ensure
the balance of the power system, the marginal price of the market will now increase, and in this
case specifi cally SMP = 405 VND/kWh.
Figure 7. Selling price when the plant is affected
As SMP increases lead to higher sales and sales of non-CfD power plants, the plants that
are not mobilized will have zero sales.
If the EF has a low Pc and Qc output, the revenue of the EF will be negative, which EF will
pay to the market.
3.4. Where the bid price and bid volume are changed
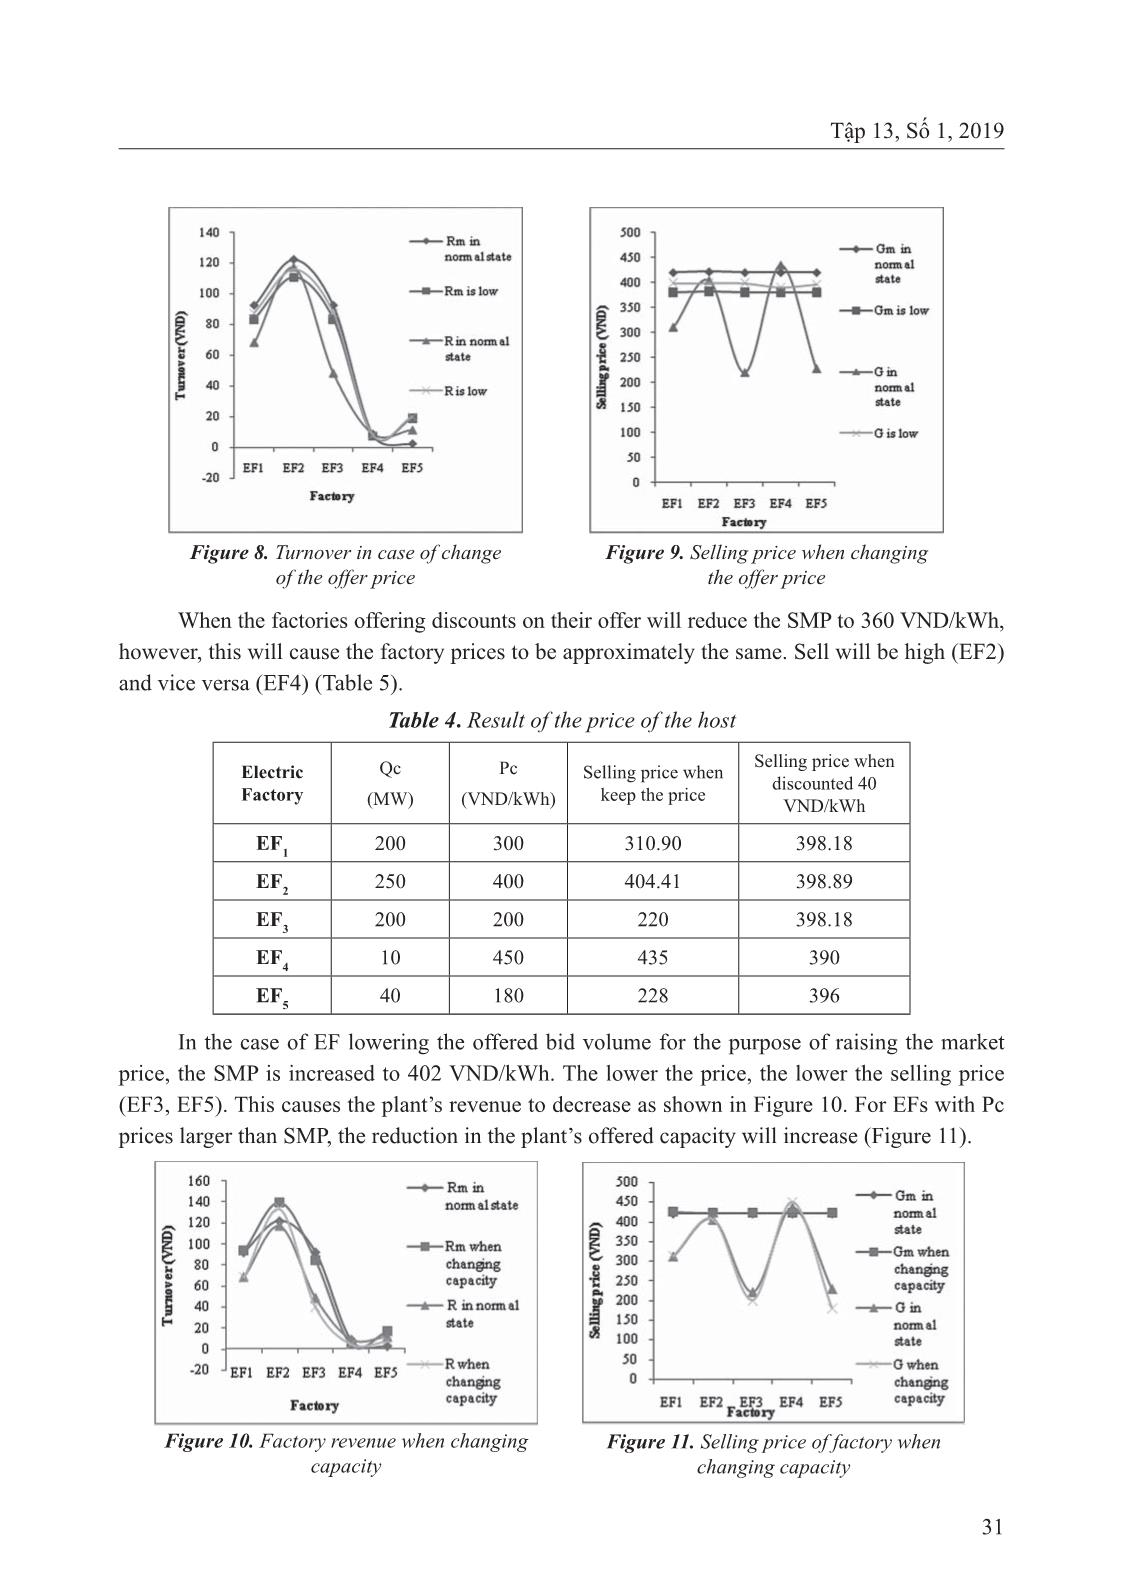
A factory may want to reduce the offer price in its bid to be mobilized in the trading
cycle. However, this will affect the marginal cost of the system, assuming that all EFs are
discounted to 40 VND/kWh, then we will have the selling price and EF sales as shown in Figures
8 and 9.
Doan Duc Tung, Luong Ngoc Toan*
31
 Tập 13, Số 1, 2019
When the factories offering discounts on their offer will reduce the SMP to 360 VND/kWh,
however, this will cause the factory prices to be approximately the same. Sell will be high (EF2)
and vice versa (EF4) (Table 5).
Table 4. Result of the price of the host
Electric
Factory
Qc
(MW)
Pc
(VND/kWh)
Selling price when
keep the price
Selling price when
discounted 40
VND/kWh
EF1 200 300 310.90 398.18
EF2 250 400 404.41 398.89
EF3 200 200 220 398.18
EF4 10 450 435 390
EF5 40 180 228 396
In the case of EF lowering the offered bid volume for the purpose of raising the market
price, the SMP is increased to 402 VND/kWh. The lower the price, the lower the selling price
(EF3, EF5). This causes the plant’s revenue to decrease as shown in Figure 10. For EFs with Pc
prices larger than SMP, the reduction in the plant’s offered capacity will increase (Figure 11).
Figure 8. Turnover in case of change
of the offer price
Figure 9. Selling price when changing
the offer price
Figure 10. Factory revenue when changing
capacity
Figure 11. Selling price of factory when
changing capacity
32
4. Conclusion
Based on the IEEE 14 bus system model, the article has assessed the infl uence of various
factors on the electricity market. We see that. When the load changes, the CfD participating plants
will have higher revenues than the non-CfD plants and vice versa. When there is a change in
contract output and contract price. Non-contracted plants will receive a settlement price equal to
the marginal cost and the revenue of the plant will depend on the capacity the plant generates. In
the event of a factory failure occurring in the electricity market.
The SMP price will increase compared to the normal state, which will cause the sales
price and sales of the plant without the CfD contract to increase, which plants will not generate
revenue will be zero. The impact of these factors on the plant’s revenue will allow the participating
factories to have an overview of the impact so that they can have a reasonable pricing plan to
bring the business highest earning.
REFERENCES
1. Ministry of Industry and Trade, Regulation on operation of competitive power generation, Circular
No. 03 dated, (2013) .
2. Daniel Kirschen and Goran Strbac, Fundamentals of Power Economics, Wiley, (2004).
3. Barrie Murray, Electricity Markets: Investment, Performance and Analysis, John Wiley & Sons,
(1998).
4. Steven Stoft, Power System Economics: Designing Markets for Electricity, Wiley-IEEE Press,
(2002).
5. University of Washington, Power Systems Test CaseArchive, https://www.ee.washington.edu/
research/pstca/
Doan Duc Tung, Luong Ngoc Toan*
File đính kèm:
 factors_affecting_the_revenue_of_the_electric_factory_in_imm.pdf

