Cải tiến thuật toán phân loại đa tín hiệu để ước lượng điện môi tương đối phức của vật liệu dựa trên phép đo phản xạ trong không gian tự do ở băng tần X
This paper aims to improve the multiple signal classification (MUSIC) algorithm to estimate the
complex relative permittivity of a metal-backed planar material sample placed in a free-space based
on reflection measurement at X-band. The measurement system consists of a pyramidal horn antena
operating at X-band and the material sample with the thickness is changed. From the measured
values of the reflection coefficients and a known thickness of a planar slab of the material samples,
the complex relative permittivity of the material sample is estimated by the proposed algorithm. The
proposed algorithm is verified with different thickness Teflon-PTFE materials at X-band. The
estimation results show that the complex relative permittivity of a large thickness sample is more
accurate than that of a small thickness one.
Trang 1
Trang 2
Trang 3
Trang 4
Trang 5
Trang 6
Trang 7
Trang 8
Trang 9

Trang 10
Tóm tắt nội dung tài liệu: Cải tiến thuật toán phân loại đa tín hiệu để ước lượng điện môi tương đối phức của vật liệu dựa trên phép đo phản xạ trong không gian tự do ở băng tần X
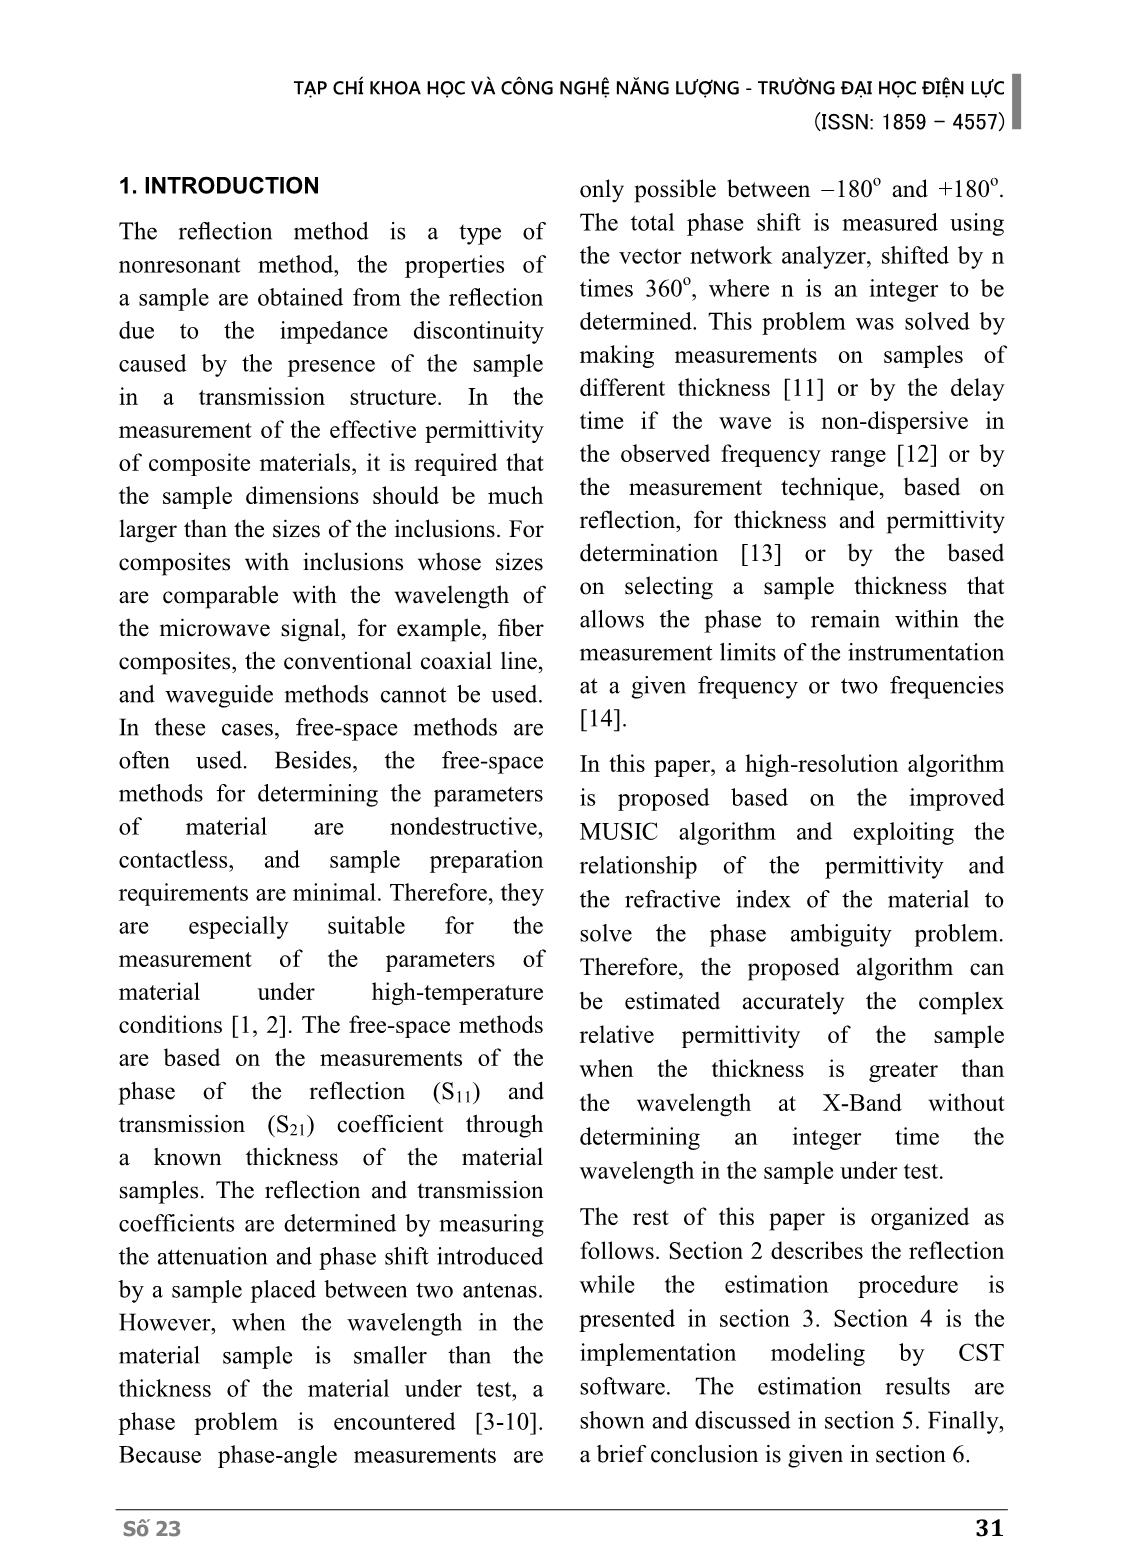
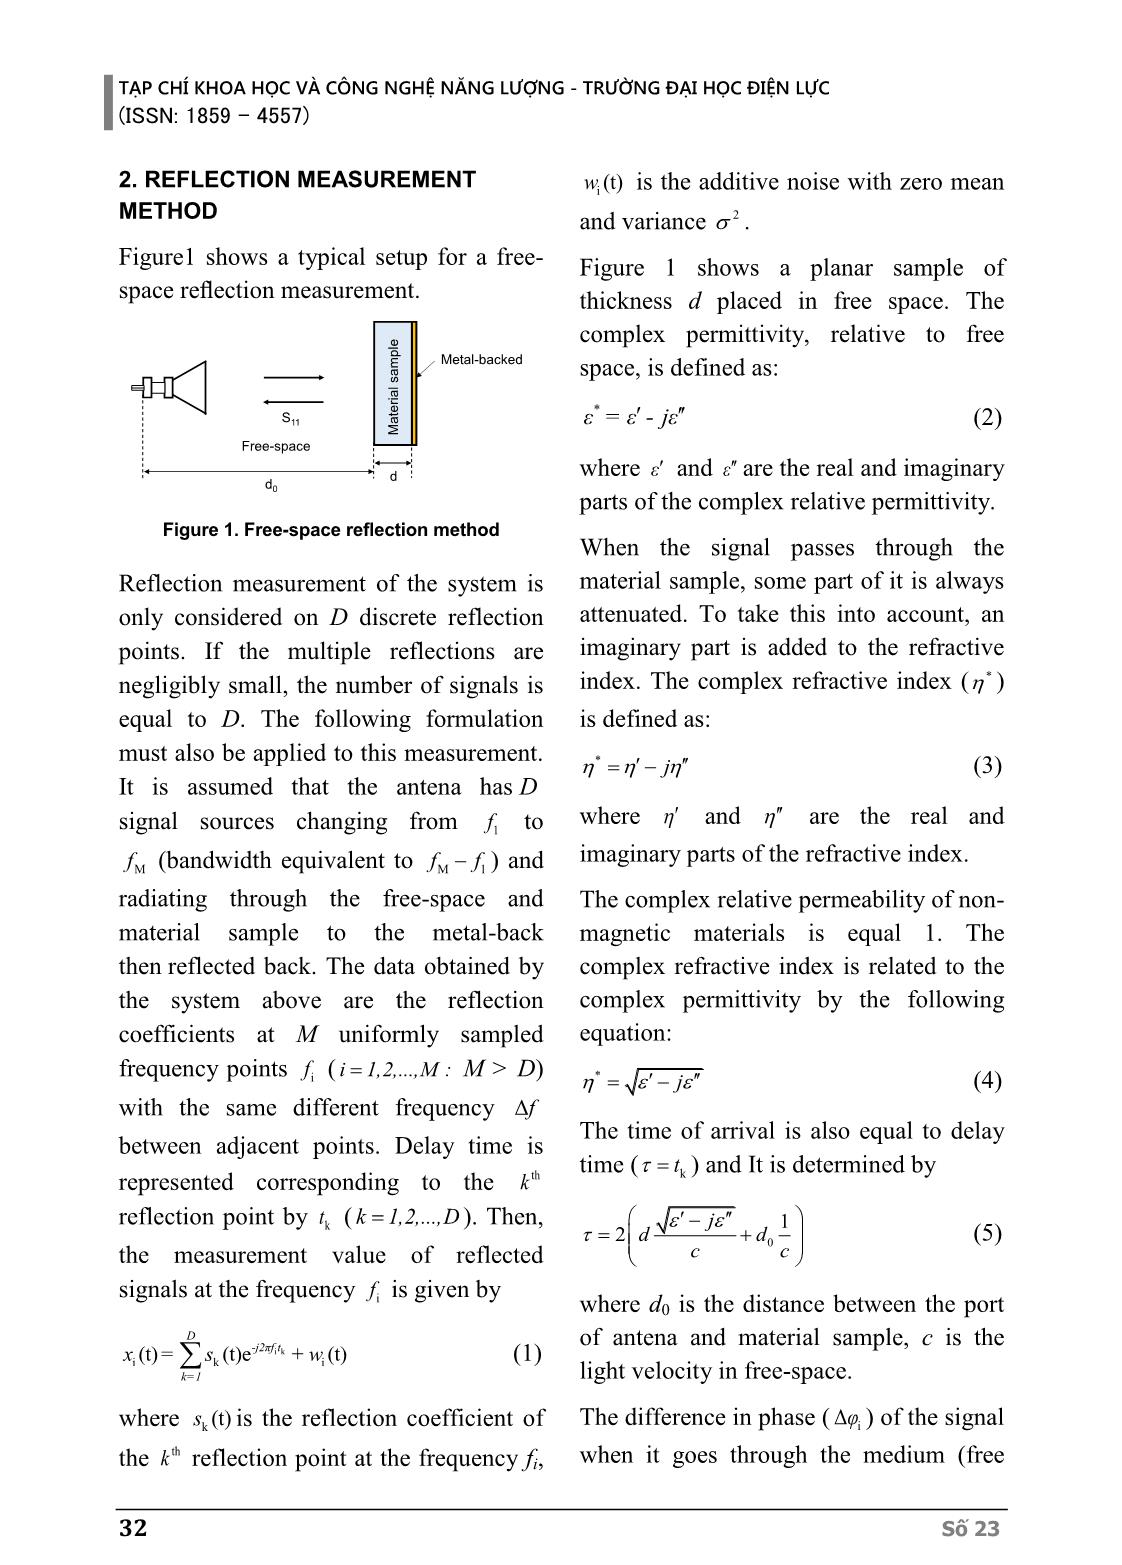
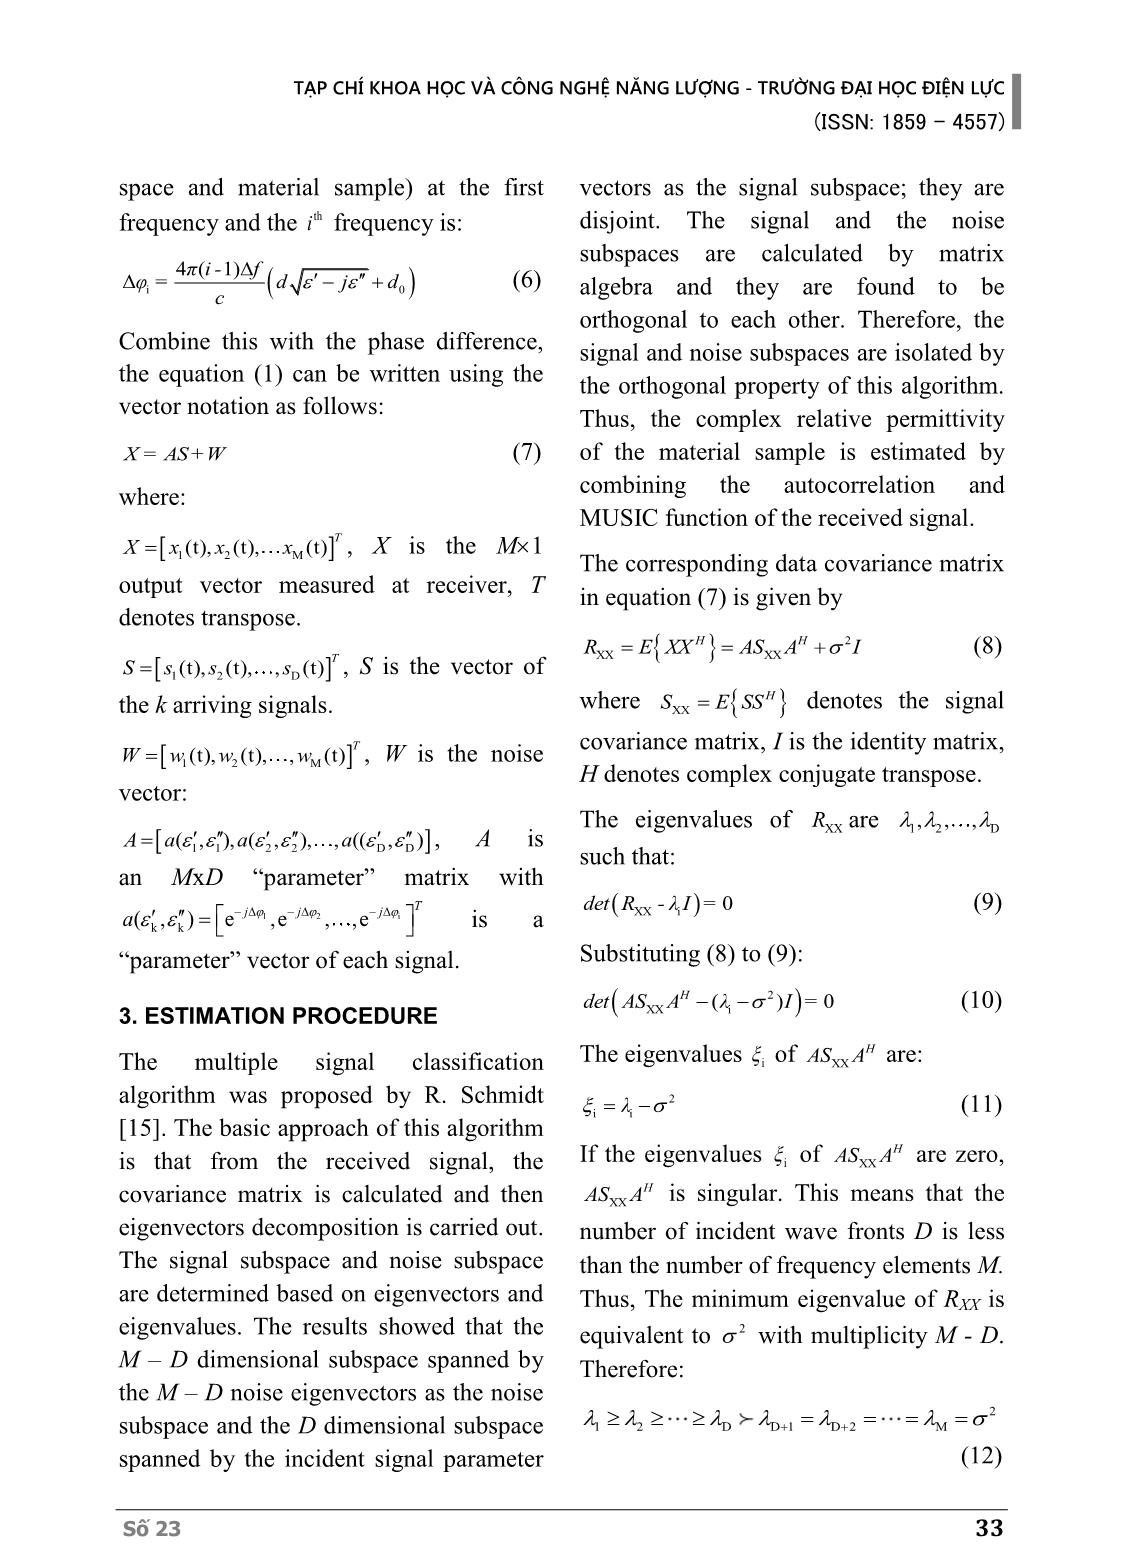
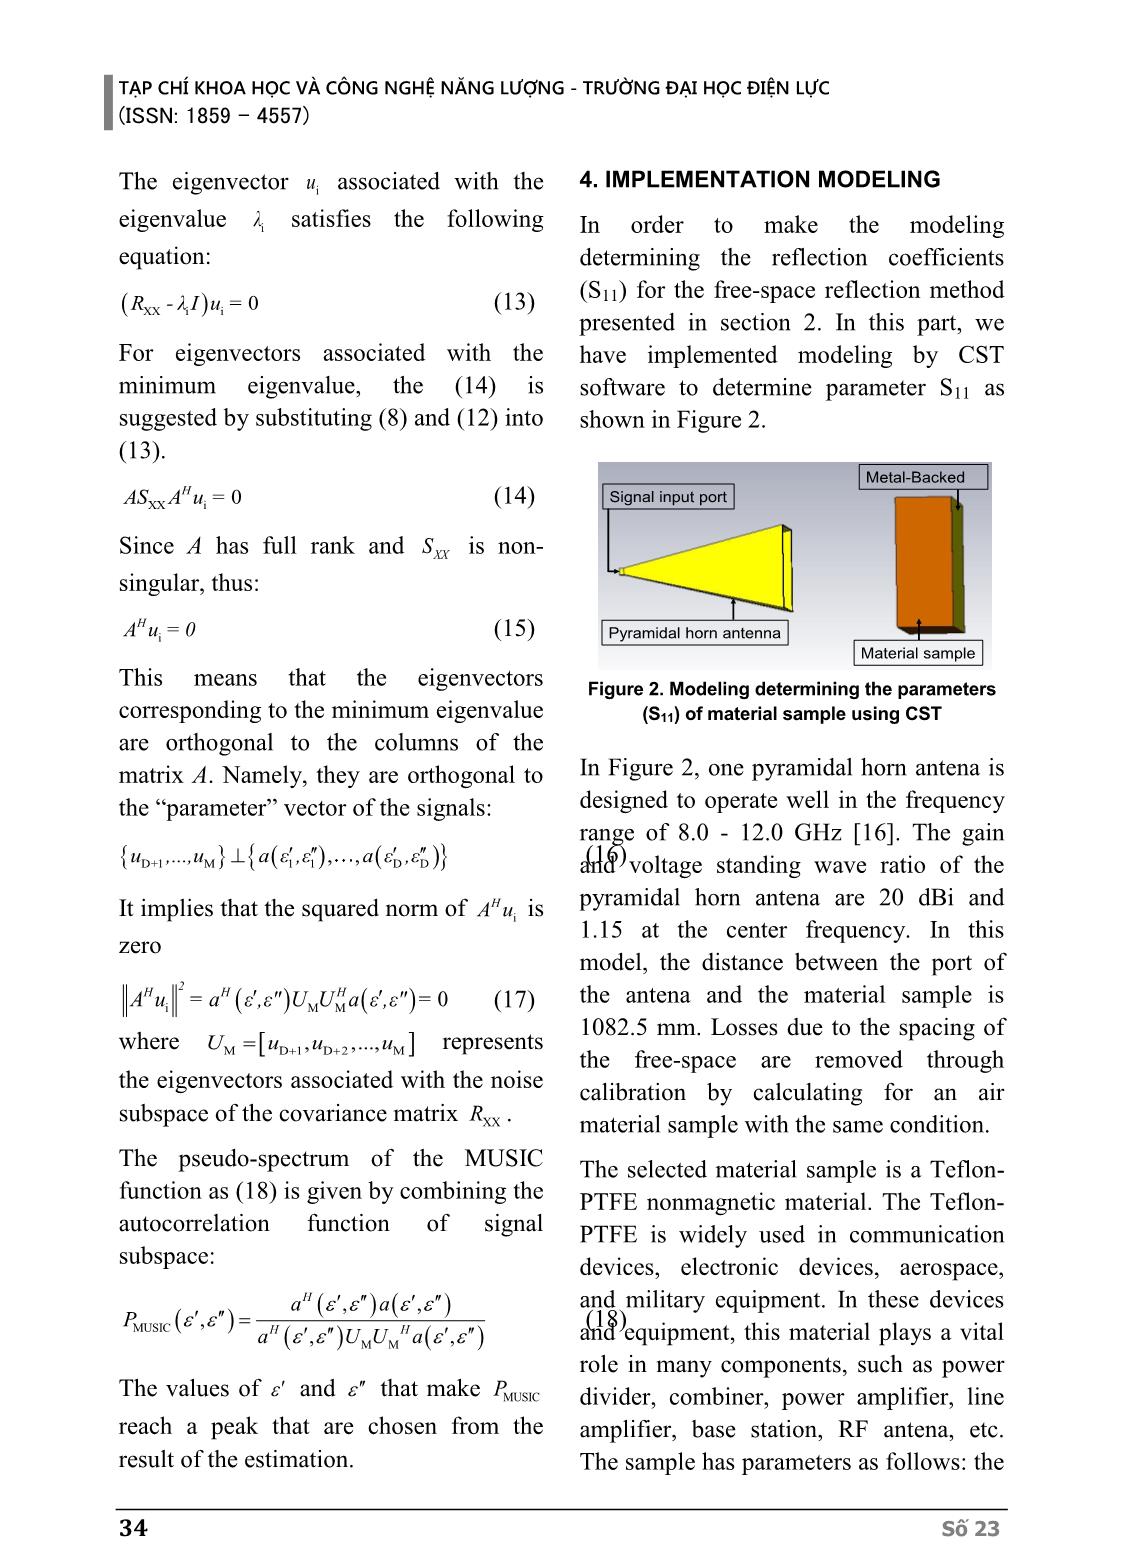
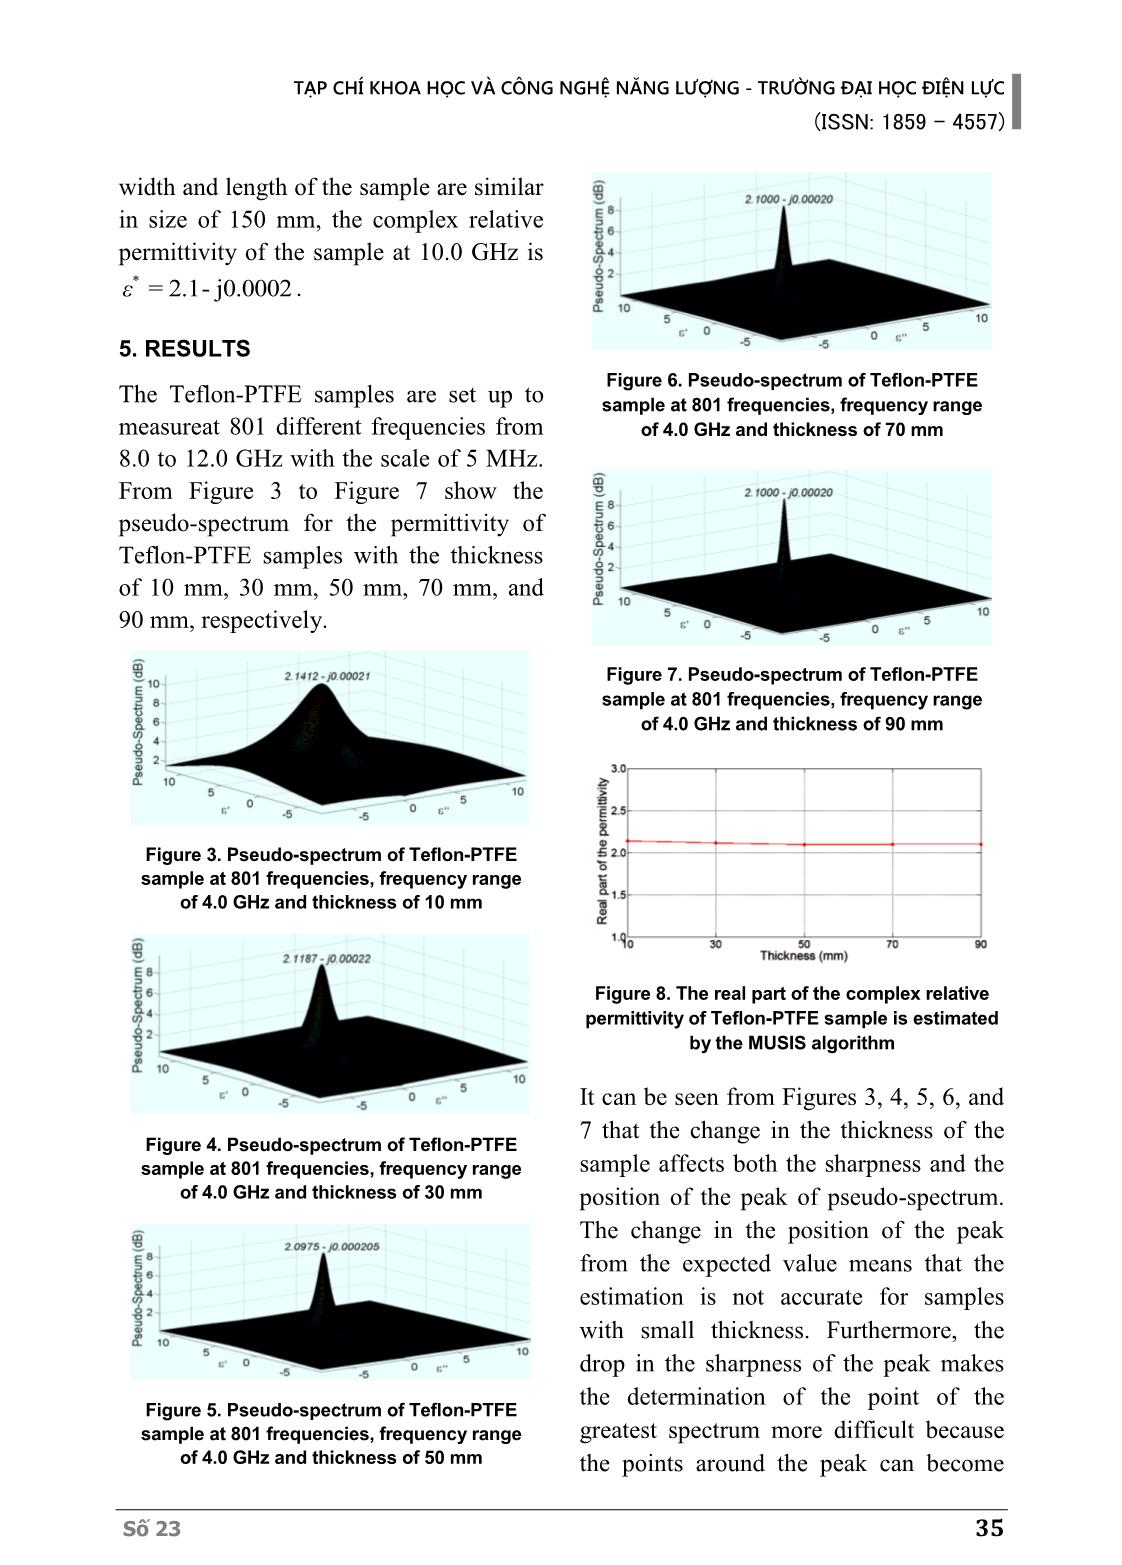
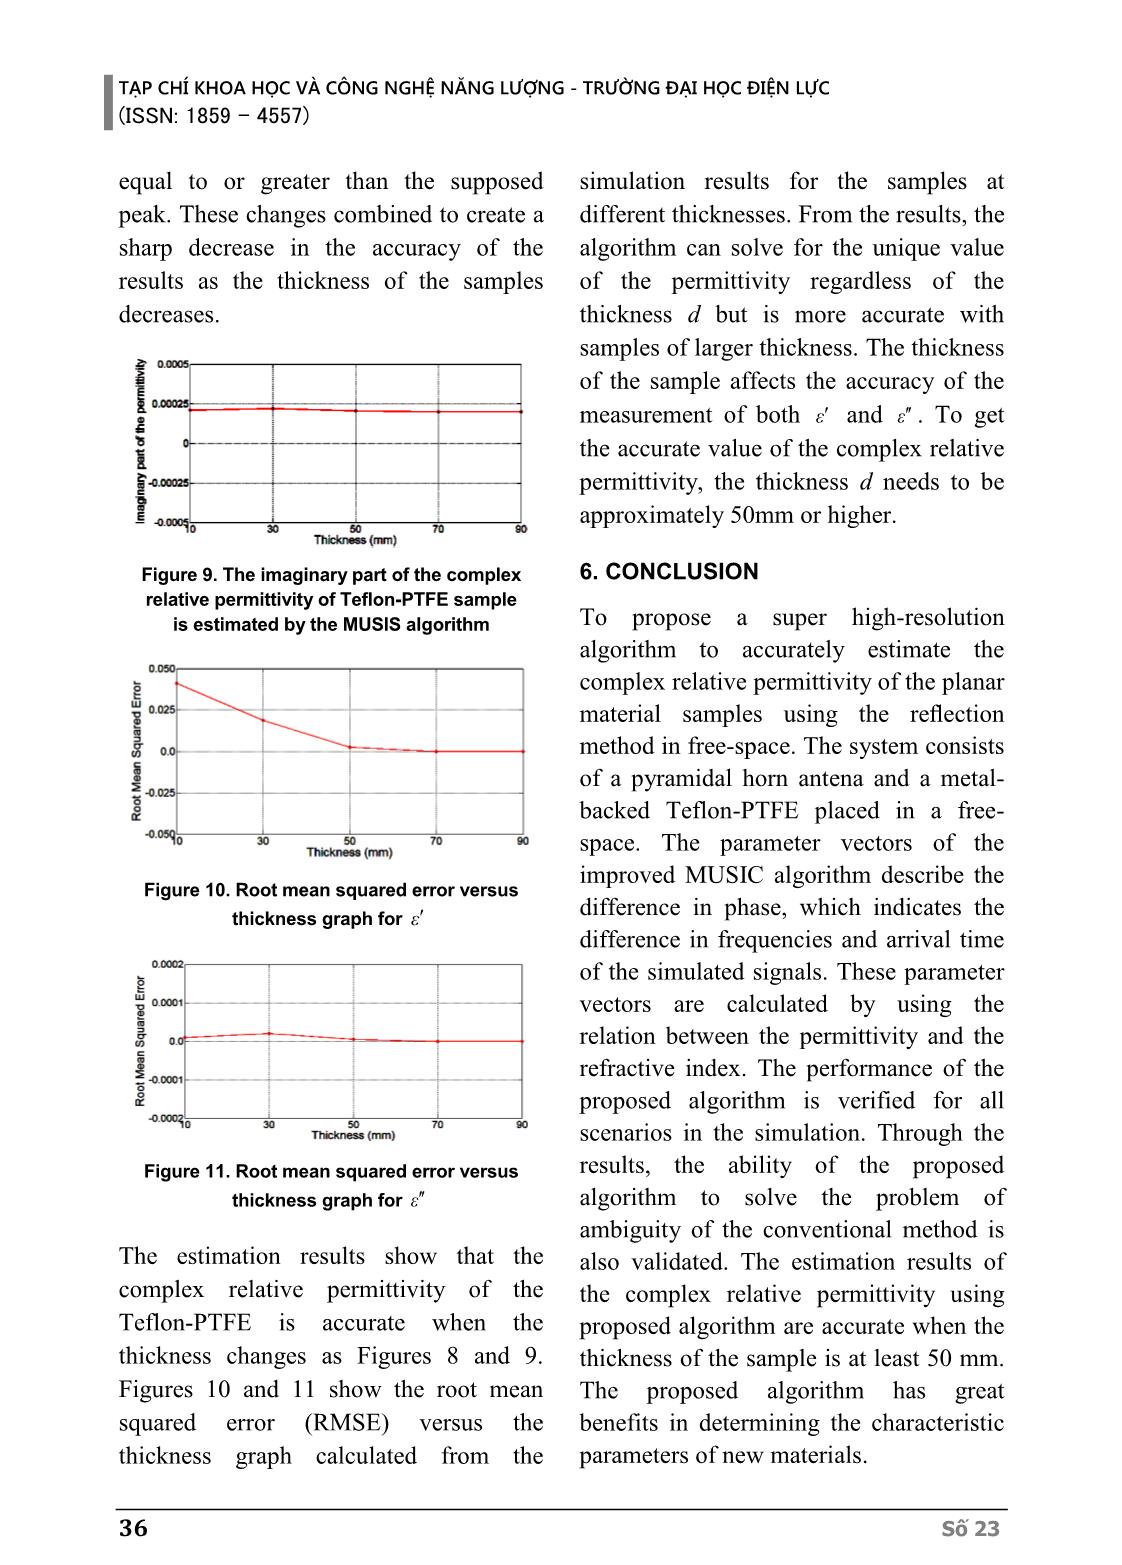
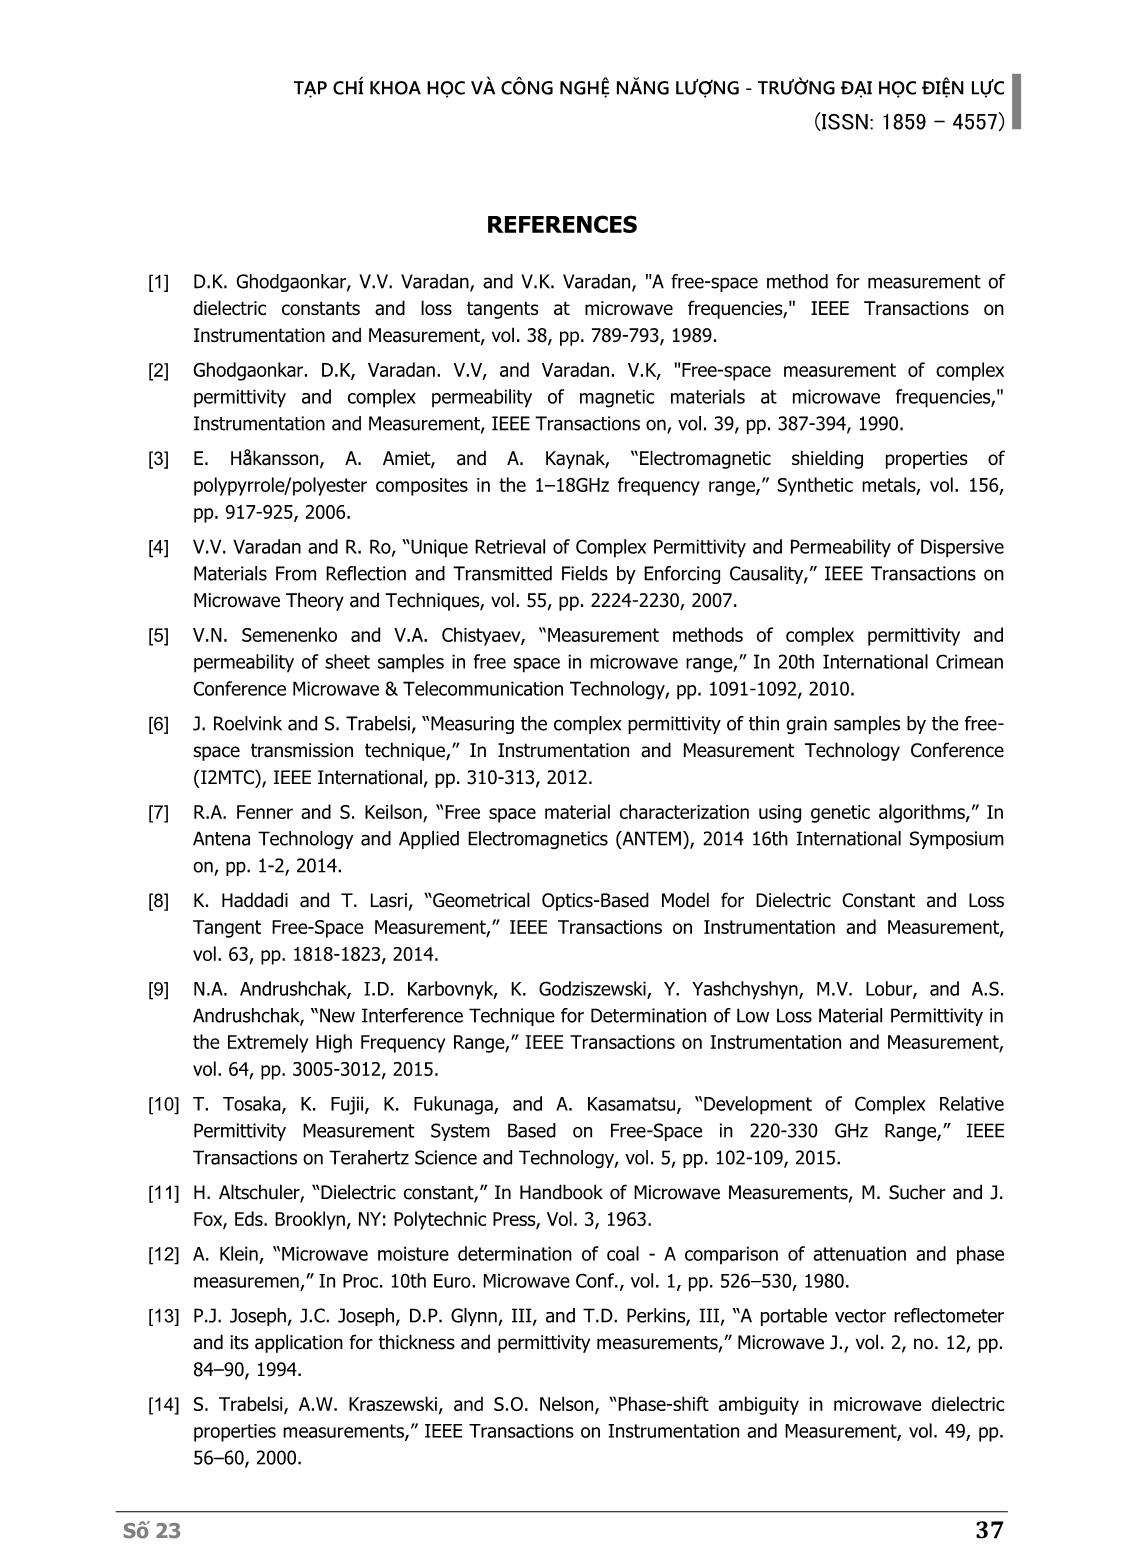
M a te ri a l s a m p le d Free-space d0 S11 Metal-backed TẠP CHÍ KHOA HỌC VÀ CÔNG NGHỆ NĂNG LƯỢNG - TRƯỜNG ĐẠI HỌC ĐIỆN LỰC (ISSN: 1859 - 4557) Số 23 33 space and material sample) at the first frequency and the thi frequency is: i 0 4 ( 1) Δ π i - f φ = d j d c (6) Combine this with the phase difference, the equation (1) can be written using the vector notation as follows: X = AS +W (7) where: 1 2 M(t), (t), (t) T X x x x , X is the M 1 output vector measured at receiver, T denotes transpose. 1 2 D(t), (t), , (t) T S s s s , S is the vector of the k arriving signals. 1 2 M(t), (t), , (t) T W w w w , W is the noise vector: 1 1 2 2 D D( , ), ( , ), , (( , ) A a a a , A is an MxD “parameter” matrix with 1 2 i k k( , ) e ,e , ,e T j j j a is a “parameter” vector of each signal. 3. ESTIMATION PROCEDURE The multiple signal classification algorithm was proposed by R. Schmidt [15]. The basic approach of this algorithm is that from the received signal, the covariance matrix is calculated and then eigenvectors decomposition is carried out. The signal subspace and noise subspace are determined based on eigenvectors and eigenvalues. The results showed that the M – D dimensional subspace spanned by the M – D noise eigenvectors as the noise subspace and the D dimensional subspace spanned by the incident signal parameter vectors as the signal subspace; they are disjoint. The signal and the noise subspaces are calculated by matrix algebra and they are found to be orthogonal to each other. Therefore, the signal and noise subspaces are isolated by the orthogonal property of this algorithm. Thus, the complex relative permittivity of the material sample is estimated by combining the autocorrelation and MUSIC function of the received signal. The corresponding data covariance matrix in equation (7) is given by XXX 2XH HR E XX AS A I (8) where XX HS E SS denotes the signal covariance matrix, I is the identity matrix, H denotes complex conjugate transpose. The eigenvalues of XXR are 1 2 D, , , such that: XX i 0det R - λ I = (9) Substituting (8) to (9): 2X iX ( ) 0Hdet =AS λ IA (10) The eigenvalues i of XX HAS A are: i i 2λ (11) If the eigenvalues i of XX HAS A are zero, XX HAS A is singular. This means that the number of incident wave fronts D is less than the number of frequency elements M. Thus, The minimum eigenvalue of RXX is equivalent to 2 with multiplicity M - D. Therefore: 2 1 2 D D 1 D 2 M (12) TẠP CHÍ KHOA HỌC VÀ CÔNG NGHỆ NĂNG LƯỢNG - TRƯỜNG ĐẠI HỌC ĐIỆN LỰC (ISSN: 1859 - 4557) 34 Số 23 The eigenvector iu associated with the eigenvalue iλ satisfies the following equation: XX i i 0R - λ I u = (13) For eigenvectors associated with the minimum eigenvalue, the (14) is suggested by substituting (8) and (12) into (13). XX i 0 HAS A u = (14) Since A has full rank and XXS is non- singular, thus: i HA u = 0 (15) This means that the eigenvectors corresponding to the minimum eigenvalue are orthogonal to the columns of the matrix A. Namely, they are orthogonal to the “parameter” vector of the signals: 1 1 D DD+1 M , ,a ε ,u ,.. ε a ε ,ε.,u (16) It implies that the squared norm of i HA u is zero M Mi 0 H 2 H Ha ε ,ε" U U a ε , =A u = ε" (17) where M D 1 D 2 M, ,..., U u u u represents the eigenvectors associated with the noise subspace of the covariance matrix XXR . The pseudo-spectrum of the MUSIC function as (18) is given by combining the autocorrelation function of signal subspace: M MUSIC M , , , , , H H H a a P a UU a (18) The values of and that make MUSICP reach a peak that are chosen from the result of the estimation. 4. IMPLEMENTATION MODELING In order to make the modeling determining the reflection coefficients (S11) for the free-space reflection method presented in section 2. In this part, we have implemented modeling by CST software to determine parameter S11 as shown in Figure 2. Figure 2. Modeling determining the parameters (S11) of material sample using CST In Figure 2, one pyramidal horn antena is designed to operate well in the frequency range of 8.0 - 12.0 GHz [16]. The gain and voltage standing wave ratio of the pyramidal horn antena are 20 dBi and 1.15 at the center frequency. In this model, the distance between the port of the antena and the material sample is 1082.5 mm. Losses due to the spacing of the free-space are removed through calibration by calculating for an air material sample with the same condition. The selected material sample is a Teflon- PTFE nonmagnetic material. The Teflon- PTFE is widely used in communication devices, electronic devices, aerospace, and military equipment. In these devices and equipment, this material plays a vital role in many components, such as power divider, combiner, power amplifier, line amplifier, base station, RF antena, etc. The sample has parameters as follows: the Signal input port Pyramidal horn antenna Material sample Metal-Backed Start Design of pyramidal horn antenna and material sample S e le c t th e p a ra m e te rs a g a in Stop? yes Set up meshes and boundaries Provide signal to antenna port at X-band Start simulation program Export parameter S11 End no TẠP CHÍ KHOA HỌC VÀ CÔNG NGHỆ NĂNG LƯỢNG - TRƯỜNG ĐẠI HỌC ĐIỆN LỰC (ISSN: 1859 - 4557) Số 23 35 width and length of the sample are similar in size of 150 mm, the complex relative permittivity of the sample at 10.0 GHz is = 2.1- j0.0002*ε . 5. RESULTS The Teflon-PTFE samples are set up to measureat 801 different frequencies from 8.0 to 12.0 GHz with the scale of 5 MHz. From Figure 3 to Figure 7 show the pseudo-spectrum for the permittivity of Teflon-PTFE samples with the thickness of 10 mm, 30 mm, 50 mm, 70 mm, and 90 mm, respectively. Figure 3. Pseudo-spectrum of Teflon-PTFE sample at 801 frequencies, frequency range of 4.0 GHz and thickness of 10 mm Figure 4. Pseudo-spectrum of Teflon-PTFE sample at 801 frequencies, frequency range of 4.0 GHz and thickness of 30 mm Figure 5. Pseudo-spectrum of Teflon-PTFE sample at 801 frequencies, frequency range of 4.0 GHz and thickness of 50 mm Figure 6. Pseudo-spectrum of Teflon-PTFE sample at 801 frequencies, frequency range of 4.0 GHz and thickness of 70 mm Figure 7. Pseudo-spectrum of Teflon-PTFE sample at 801 frequencies, frequency range of 4.0 GHz and thickness of 90 mm Figure 8. The real part of the complex relative permittivity of Teflon-PTFE sample is estimated by the MUSIS algorithm It can be seen from Figures 3, 4, 5, 6, and 7 that the change in the thickness of the sample affects both the sharpness and the position of the peak of pseudo-spectrum. The change in the position of the peak from the expected value means that the estimation is not accurate for samples with small thickness. Furthermore, the drop in the sharpness of the peak makes the determination of the point of the greatest spectrum more difficult because the points around the peak can become TẠP CHÍ KHOA HỌC VÀ CÔNG NGHỆ NĂNG LƯỢNG - TRƯỜNG ĐẠI HỌC ĐIỆN LỰC (ISSN: 1859 - 4557) 36 Số 23 equal to or greater than the supposed peak. These changes combined to create a sharp decrease in the accuracy of the results as the thickness of the samples decreases. Figure 9. The imaginary part of the complex relative permittivity of Teflon-PTFE sample is estimated by the MUSIS algorithm Figure 10. Root mean squared error versus thickness graph for ε Figure 11. Root mean squared error versus thickness graph for ε The estimation results show that the complex relative permittivity of the Teflon-PTFE is accurate when the thickness changes as Figures 8 and 9. Figures 10 and 11 show the root mean squared error (RMSE) versus the thickness graph calculated from the simulation results for the samples at different thicknesses. From the results, the algorithm can solve for the unique value of the permittivity regardless of the thickness d but is more accurate with samples of larger thickness. The thickness of the sample affects the accuracy of the measurement of both ε and ε . To get the accurate value of the complex relative permittivity, the thickness d needs to be approximately 50mm or higher. 6. CONCLUSION To propose a super high-resolution algorithm to accurately estimate the complex relative permittivity of the planar material samples using the reflection method in free-space. The system consists of a pyramidal horn antena and a metal- backed Teflon-PTFE placed in a free- space. The parameter vectors of the improved MUSIC algorithm describe the difference in phase, which indicates the difference in frequencies and arrival time of the simulated signals. These parameter vectors are calculated by using the relation between the permittivity and the refractive index. The performance of the proposed algorithm is verified for all scenarios in the simulation. Through the results, the ability of the proposed algorithm to solve the problem of ambiguity of the conventional method is also validated. The estimation results of the complex relative permittivity using proposed algorithm are accurate when the thickness of the sample is at least 50 mm. The proposed algorithm has great benefits in determining the characteristic parameters of new materials. TẠP CHÍ KHOA HỌC VÀ CÔNG NGHỆ NĂNG LƯỢNG - TRƯỜNG ĐẠI HỌC ĐIỆN LỰC (ISSN: 1859 - 4557) Số 23 37 REFERENCES [1] D.K. Ghodgaonkar, V.V. Varadan, and V.K. Varadan, "A free-space method for measurement of dielectric constants and loss tangents at microwave frequencies," IEEE Transactions on Instrumentation and Measurement, vol. 38, pp. 789-793, 1989. [2] Ghodgaonkar. D.K, Varadan. V.V, and Varadan. V.K, "Free-space measurement of complex permittivity and complex permeability of magnetic materials at microwave frequencies," Instrumentation and Measurement, IEEE Transactions on, vol. 39, pp. 387-394, 1990. [3] E. Håkansson, A. Amiet, and A. Kaynak, “Electromagnetic shielding properties of polypyrrole/polyester composites in the 1–18GHz frequency range,” Synthetic metals, vol. 156, pp. 917-925, 2006. [4] V.V. Varadan and R. Ro, “Unique Retrieval of Complex Permittivity and Permeability of Dispersive Materials From Reflection and Transmitted Fields by Enforcing Causality,” IEEE Transactions on Microwave Theory and Techniques, vol. 55, pp. 2224-2230, 2007. [5] V.N. Semenenko and V.A. Chistyaev, “Measurement methods of complex permittivity and permeability of sheet samples in free space in microwave range,” In 20th International Crimean Conference Microwave & Telecommunication Technology, pp. 1091-1092, 2010. [6] J. Roelvink and S. Trabelsi, “Measuring the complex permittivity of thin grain samples by the free- space transmission technique,” In Instrumentation and Measurement Technology Conference (I2MTC), IEEE International, pp. 310-313, 2012. [7] R.A. Fenner and S. Keilson, “Free space material characterization using genetic algorithms,” In Antena Technology and Applied Electromagnetics (ANTEM), 2014 16th International Symposium on, pp. 1-2, 2014. [8] K. Haddadi and T. Lasri, “Geometrical Optics-Based Model for Dielectric Constant and Loss Tangent Free-Space Measurement,” IEEE Transactions on Instrumentation and Measurement, vol. 63, pp. 1818-1823, 2014. [9] N.A. Andrushchak, I.D. Karbovnyk, K. Godziszewski, Y. Yashchyshyn, M.V. Lobur, and A.S. Andrushchak, “New Interference Technique for Determination of Low Loss Material Permittivity in the Extremely High Frequency Range,” IEEE Transactions on Instrumentation and Measurement, vol. 64, pp. 3005-3012, 2015. [10] T. Tosaka, K. Fujii, K. Fukunaga, and A. Kasamatsu, “Development of Complex Relative Permittivity Measurement System Based on Free-Space in 220-330 GHz Range,” IEEE Transactions on Terahertz Science and Technology, vol. 5, pp. 102-109, 2015. [11] H. Altschuler, “Dielectric constant,” In Handbook of Microwave Measurements, M. Sucher and J. Fox, Eds. Brooklyn, NY: Polytechnic Press, Vol. 3, 1963. [12] A. Klein, “Microwave moisture determination of coal - A comparison of attenuation and phase measuremen,” In Proc. 10th Euro. Microwave Conf., vol. 1, pp. 526–530, 1980. [13] P.J. Joseph, J.C. Joseph, D.P. Glynn, III, and T.D. Perkins, III, “A portable vector reflectometer and its application for thickness and permittivity measurements,” Microwave J., vol. 2, no. 12, pp. 84–90, 1994. [14] S. Trabelsi, A.W. Kraszewski, and S.O. Nelson, “Phase-shift ambiguity in microwave dielectric properties measurements,” IEEE Transactions on Instrumentation and Measurement, vol. 49, pp. 56–60, 2000. TẠP CHÍ KHOA HỌC VÀ CÔNG NGHỆ NĂNG LƯỢNG - TRƯỜNG ĐẠI HỌC ĐIỆN LỰC (ISSN: 1859 - 4557) 38 Số 23 [15] R. Schmidt, “Multiple emitter location and signal parameter estimation,” IEEE Transactions on Antenas and Propagation, vol. 34, pp. 276-280, 1986. [16] I.P. Arvind Roy, "Design and Analysis of X band Pyramidal Horn Antena Using HFSS," International Journal of Advanced Research in Electronics and Communication Engineering, vol. 4, pp. 488-493, 2015. Biography: Ho Manh Cuong was born in Ha Noi, Vietnam, in 1977. He received the Bachelor degree in Radio Physics and Electronics at VNU University of Science in 1999 and the Master degree in Electronic Engineering at Le Quy Don University in 2006. In 2019 he received a Ph.D. degree in Electronics Engineering at Le Quy Don University. Now, he is a lecturer in Electric Power University, Vietnam. He has published many national as well as international papers. His current research interests are microwave engineering, antena, electromagnetic theory. Le Trong Hieu was born in Hanoi, Vietnam in 1986. He graduated at Le Quy Don Technical University in Electronics and Telecommunications, in June 2009. He received the M.Sc. and Ph.D. degrees in Electromagnetic Field and Microwave Technology from the State Key Laboratory of Millimeter Waves, School of Information Science and Engineering, Southeast University, Nanjing, China, in 2013 and 2018, respectively. Now, he is a lecturer in the Faculty of Electronics and Telecommunications, Electric Power University, Hanoi, Vietnam. His fields of research are RF/Microwave and Millimeter-waves circuits such as filters, amplifiers, antenas for wireless communication applications. TẠP CHÍ KHOA HỌC VÀ CÔNG NGHỆ NĂNG LƯỢNG - TRƯỜNG ĐẠI HỌC ĐIỆN LỰC (ISSN: 1859 - 4557) Số 23 39
File đính kèm:
 cai_tien_thuat_toan_phan_loai_da_tin_hieu_de_uoc_luong_dien.pdf

