Bài giảng Xử lý tín hiệu số - Chương 7: Frequency analysis of signals and systems - Hà Hoàng Kha
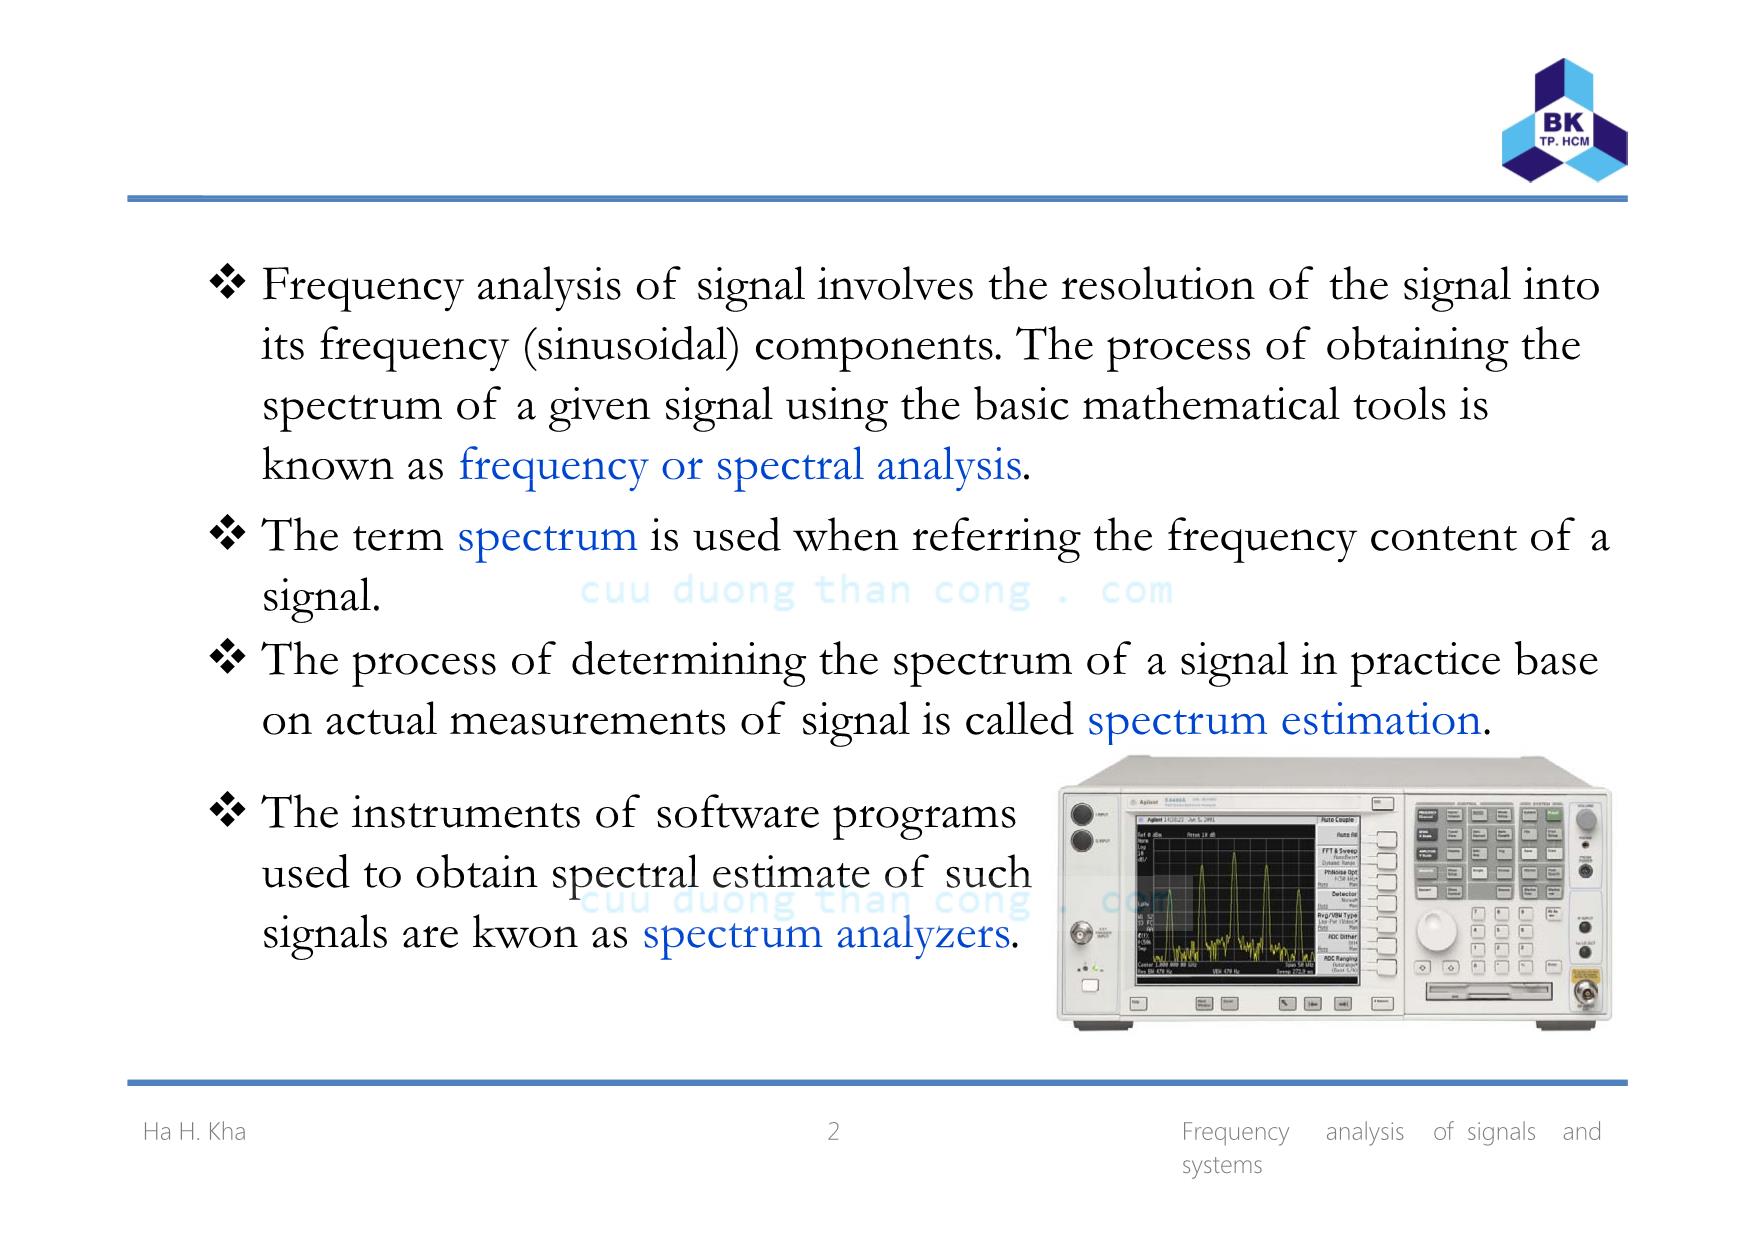
Frequency analysis of signal involves the resolution of the signal into
its freq enc (sin soidal) components The process of obtaining the uency (sinusoidal) components. The process of obtaining the
spectrum of a given signal using the basic mathematical tools is
known as frequency or spectral analysis.
The term spectrum is used when referring the frequency content of a
signal.
The process of determining the spectrum of a signal in practice base
on actual measurements of signal is called spectrum estimation.
The instruments of software programs
used to obtain spectral estimate of such
signals are kwon as spectrum analyzers.
The frequency analysis of signals and systems have three major uses
in DSP:
1) The numerical computation of frequency spectrum of a signal.
2) The efficient implementation of convolution by the fast Fourier
transform (FFT)
3) The coding of waves, such as speech or pictures, for efficient
transmission and storage
Trang 1
Trang 2
Trang 3
Trang 4
Trang 5
Trang 6
Trang 7
Trang 8
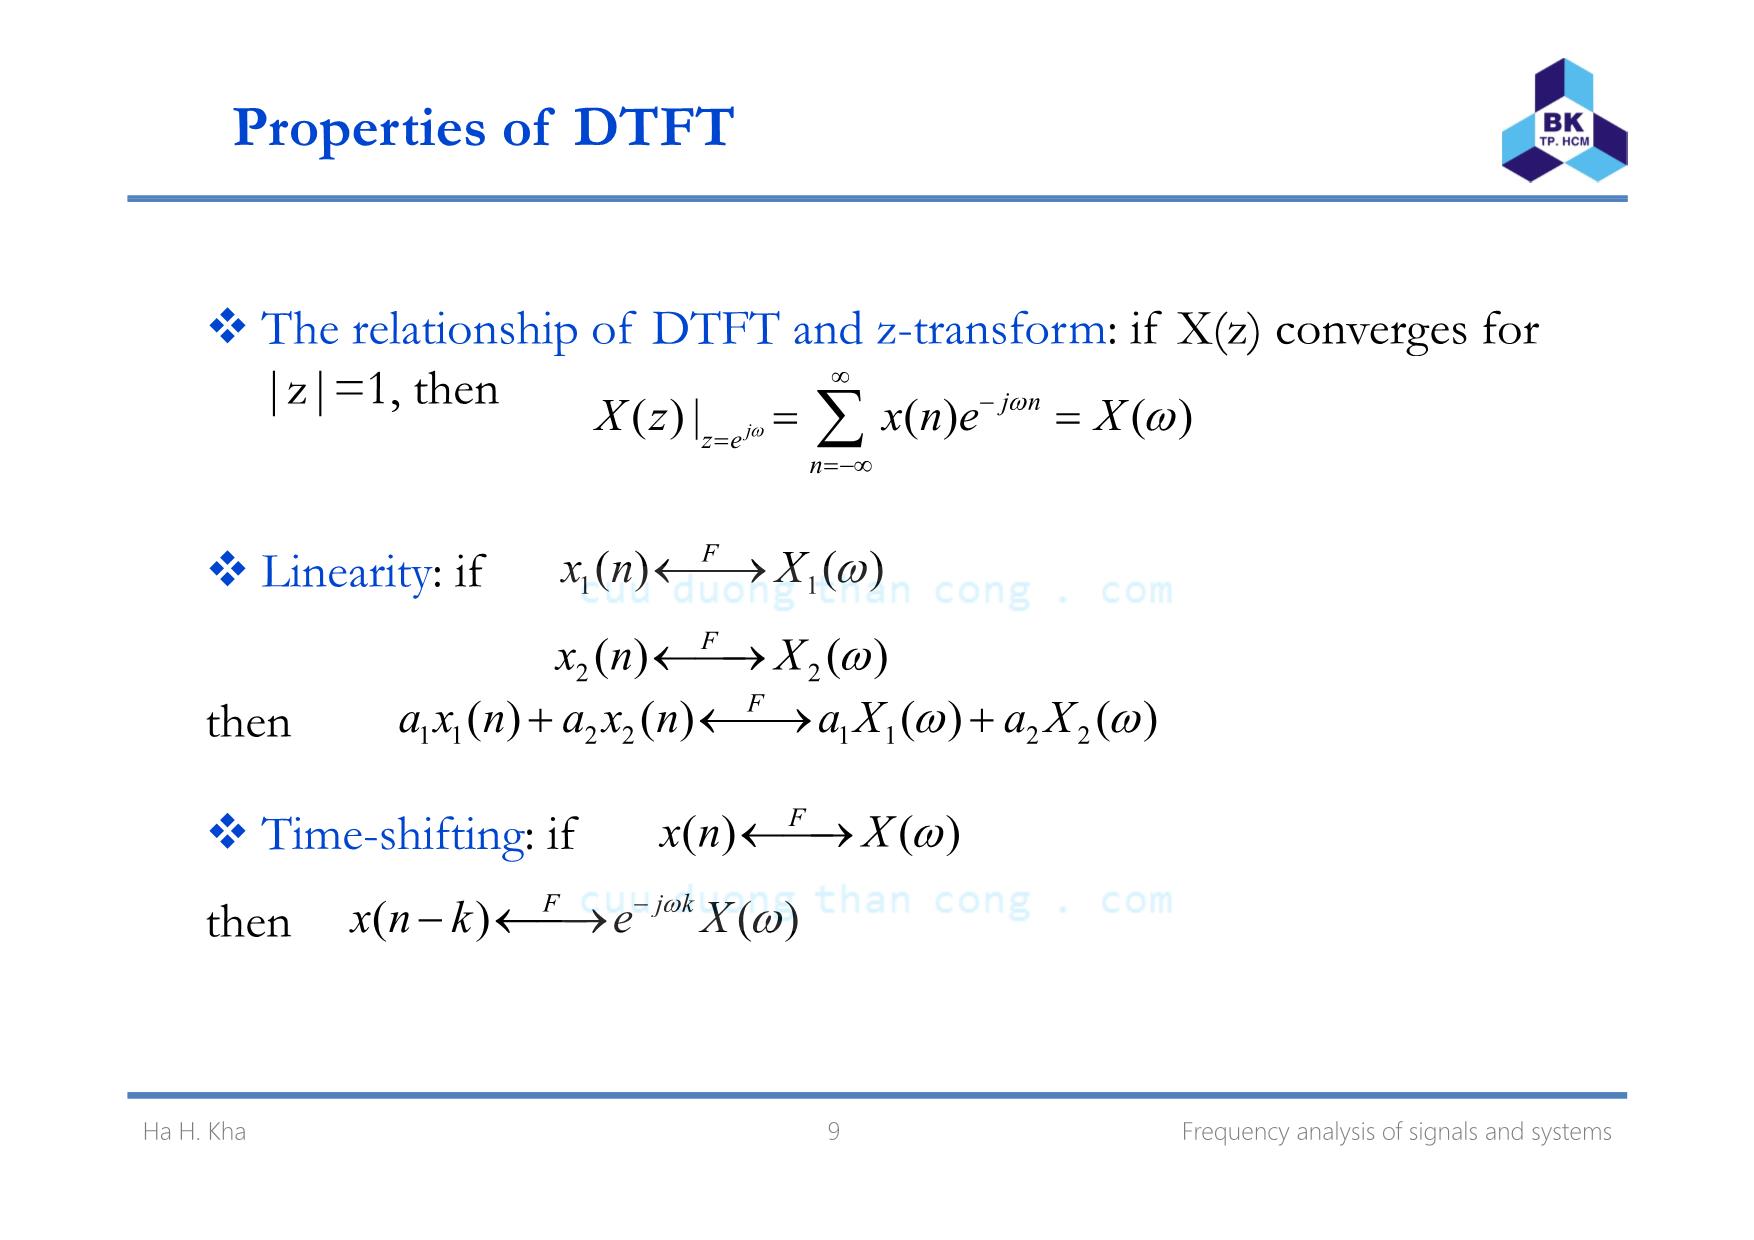
Trang 9
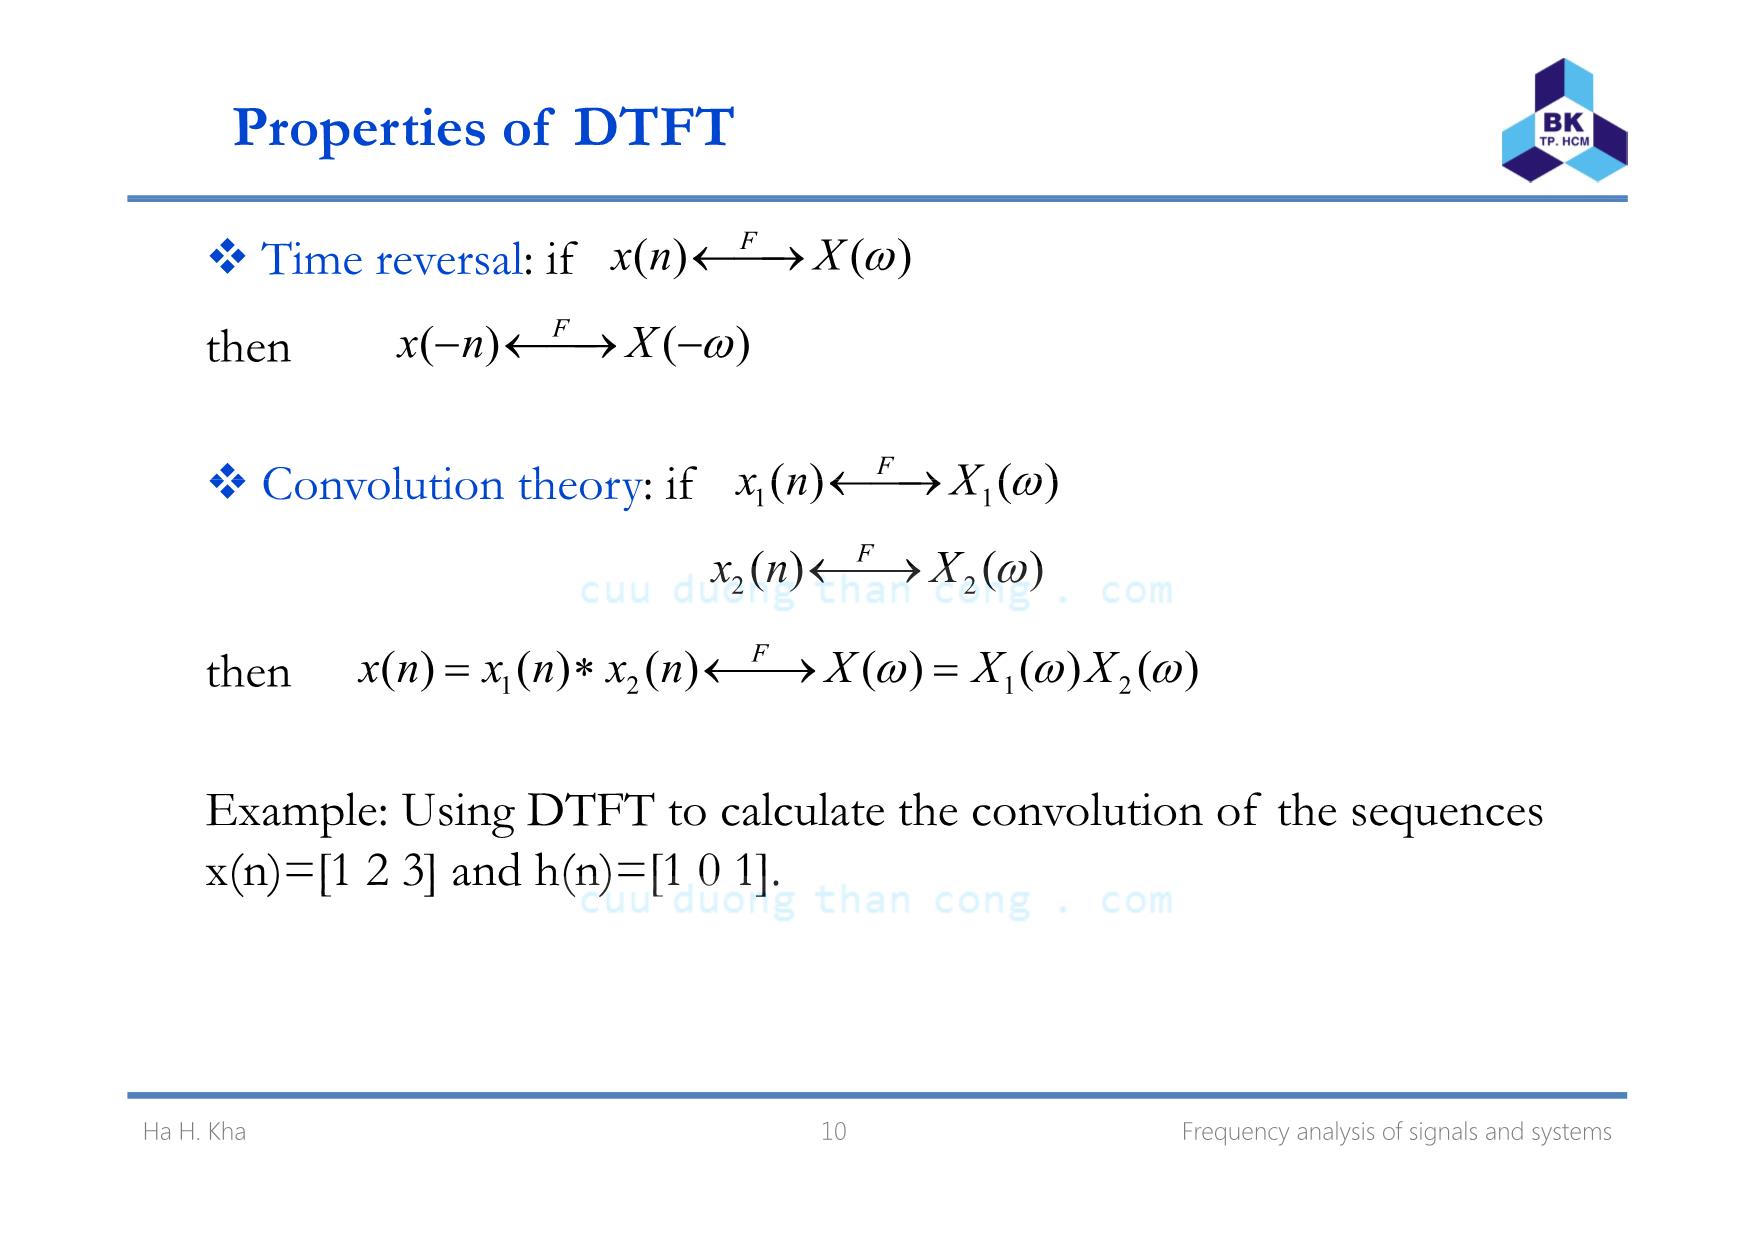
Trang 10
Tải về để xem bản đầy đủ
Tóm tắt nội dung tài liệu: Bài giảng Xử lý tín hiệu số - Chương 7: Frequency analysis of signals and systems - Hà Hoàng Kha
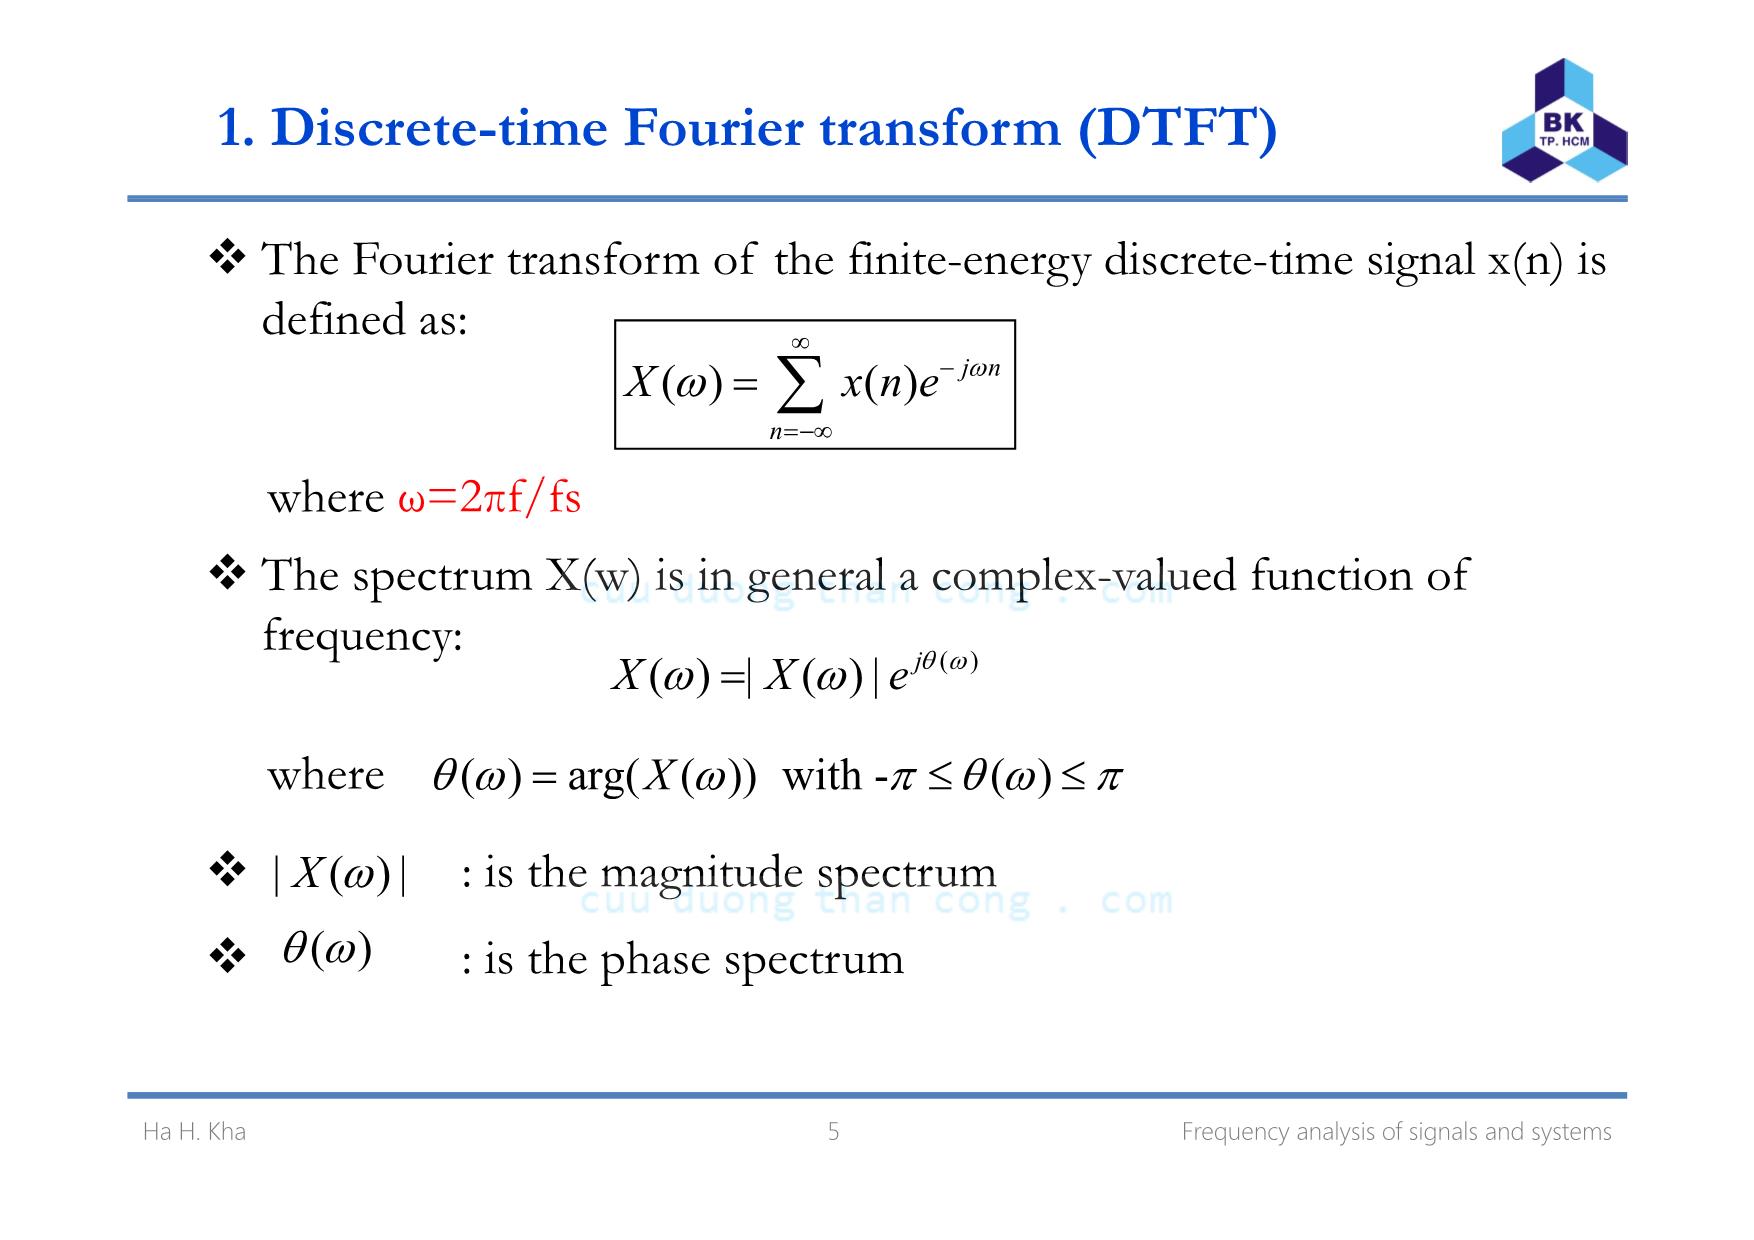
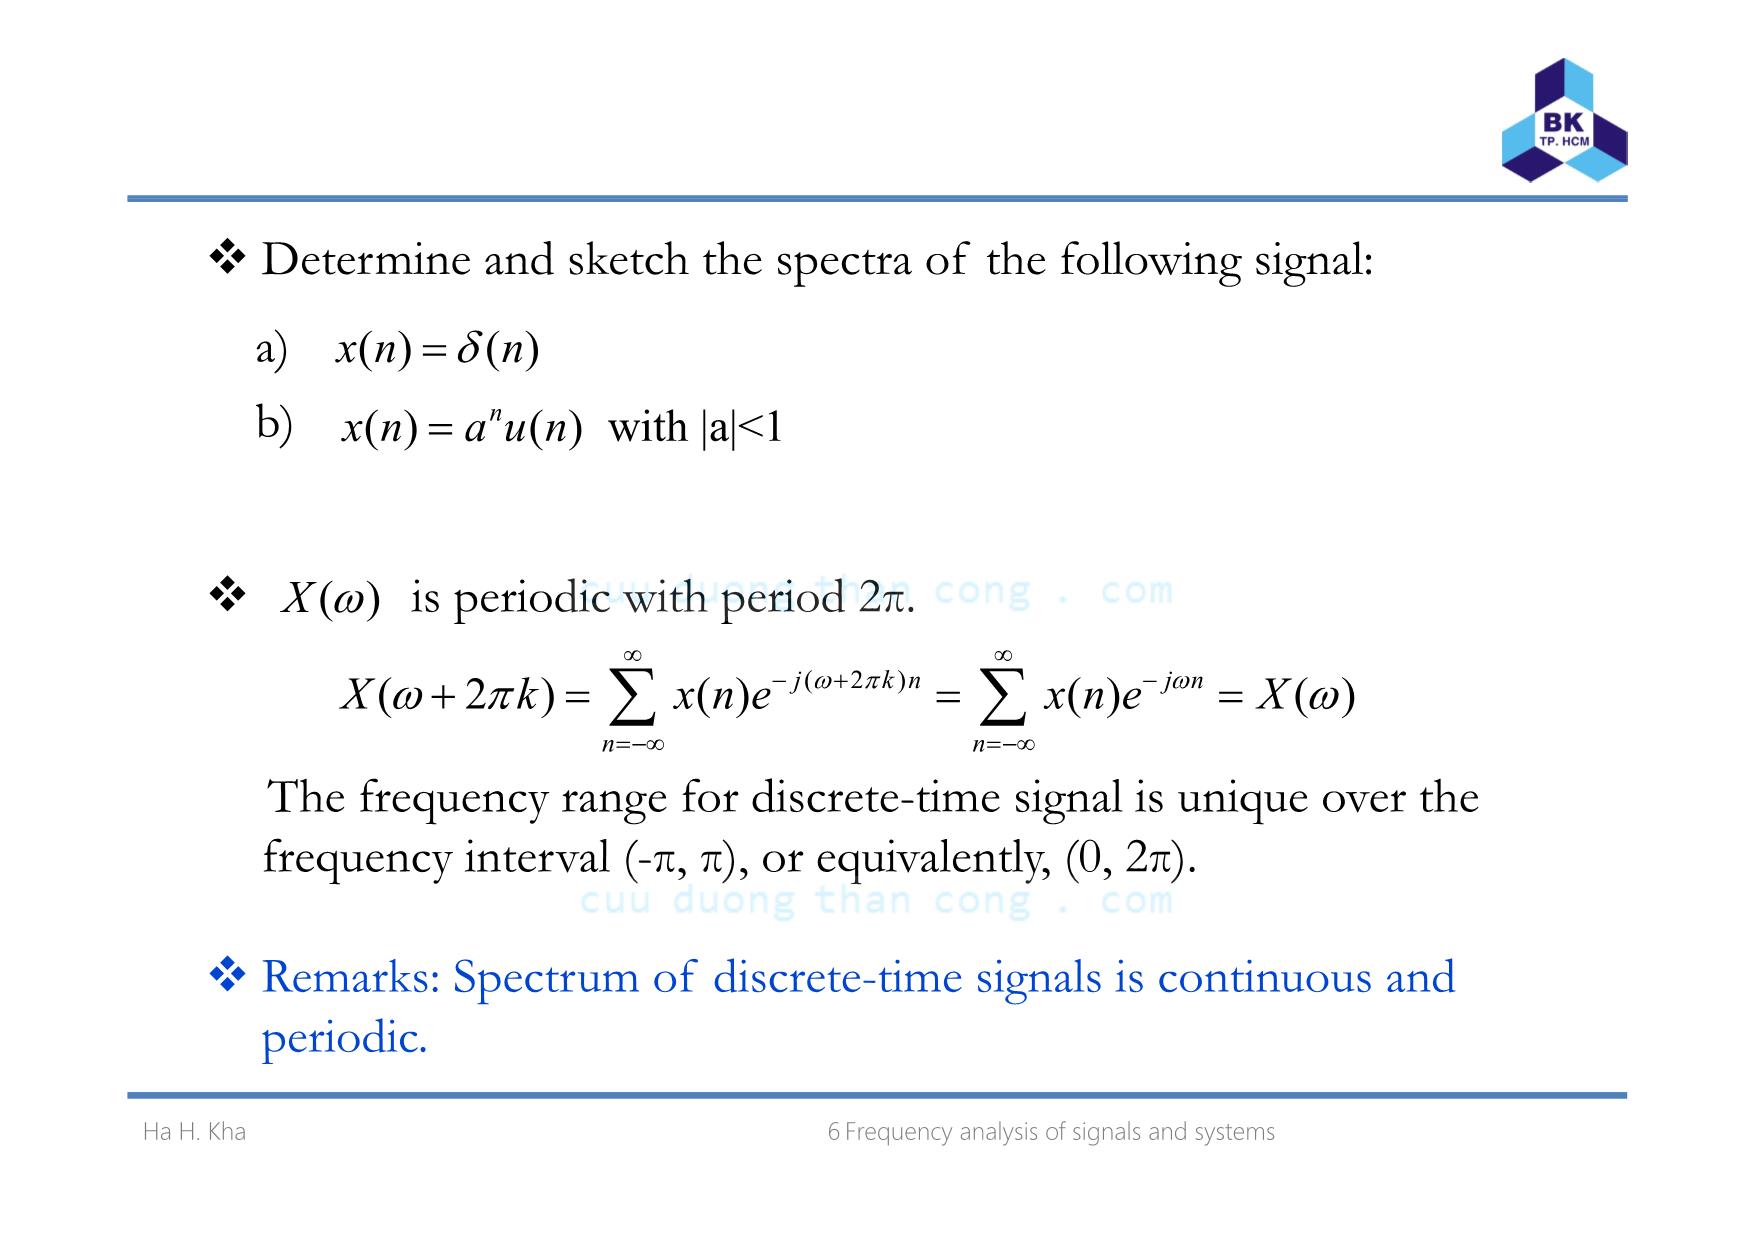
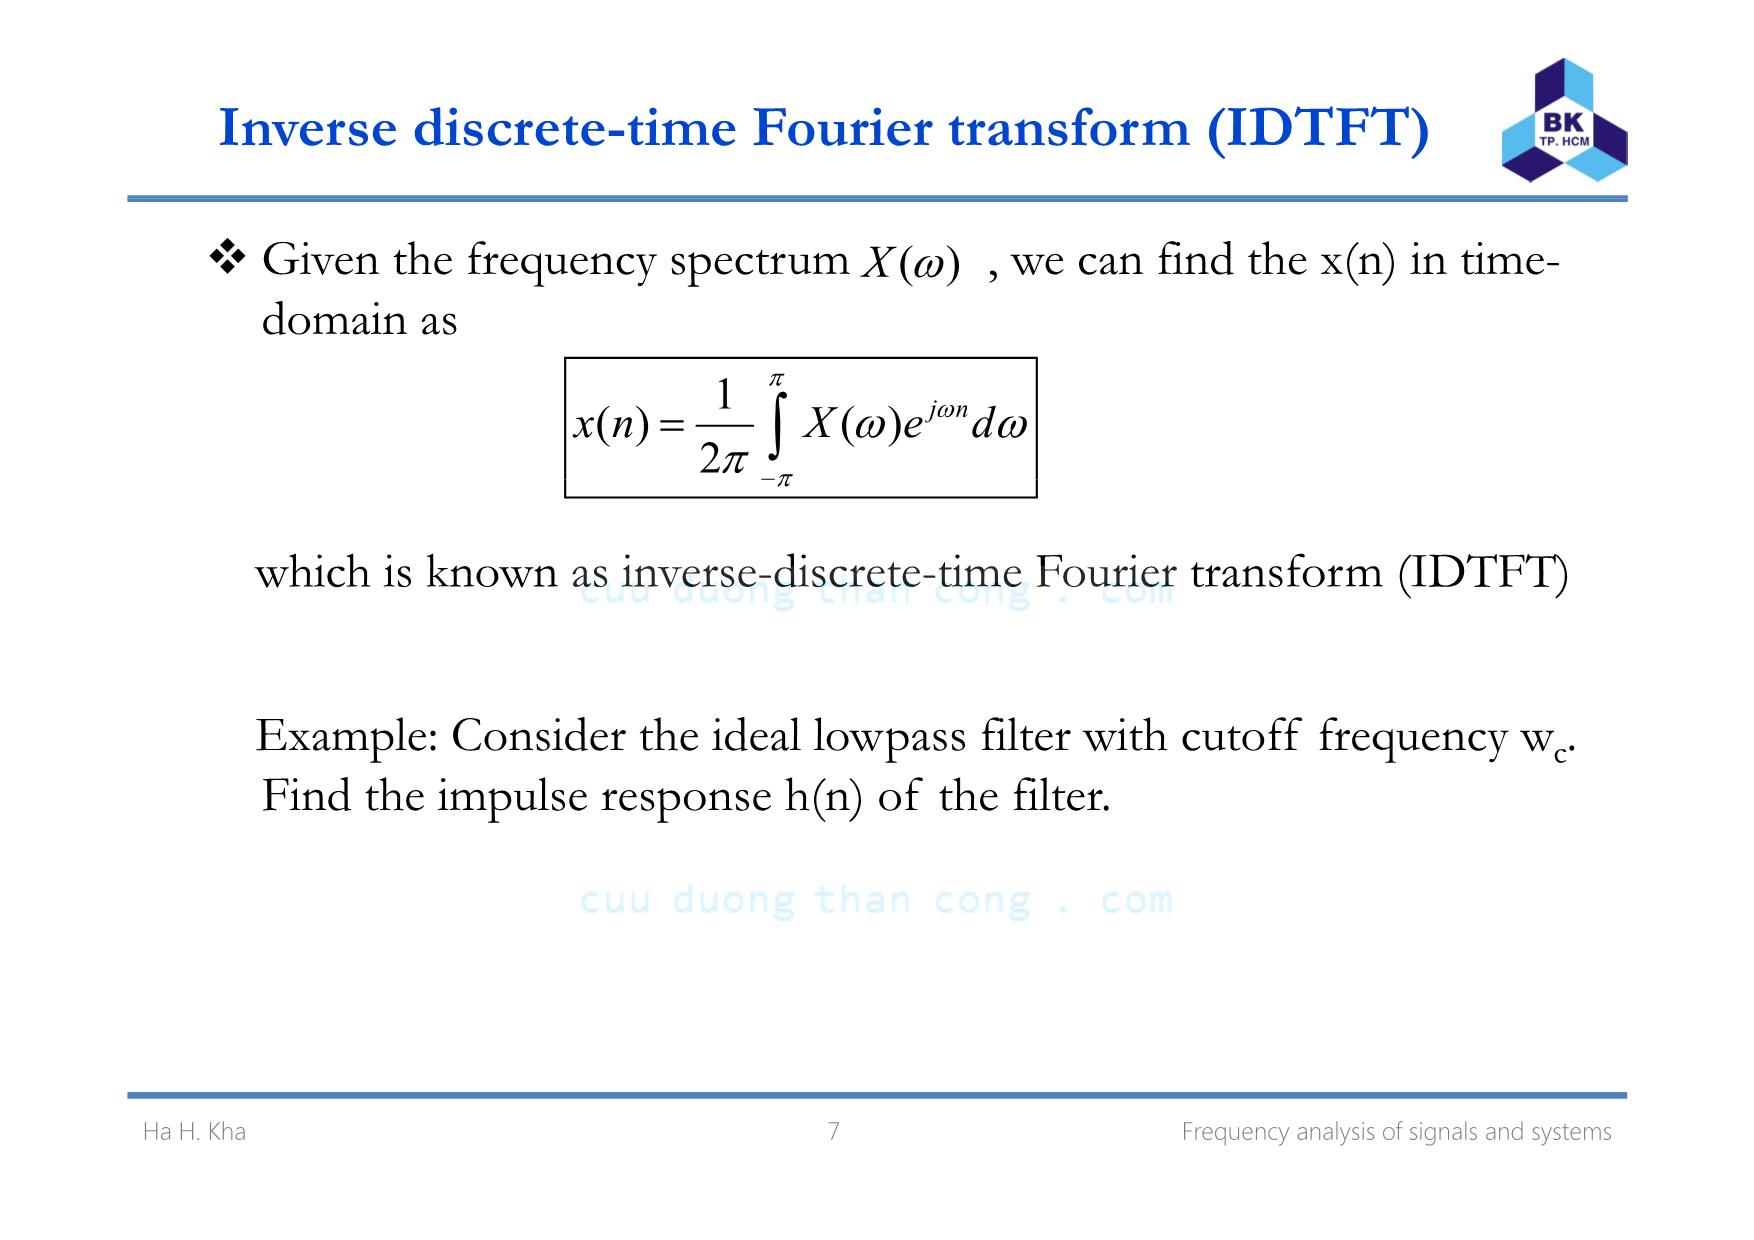
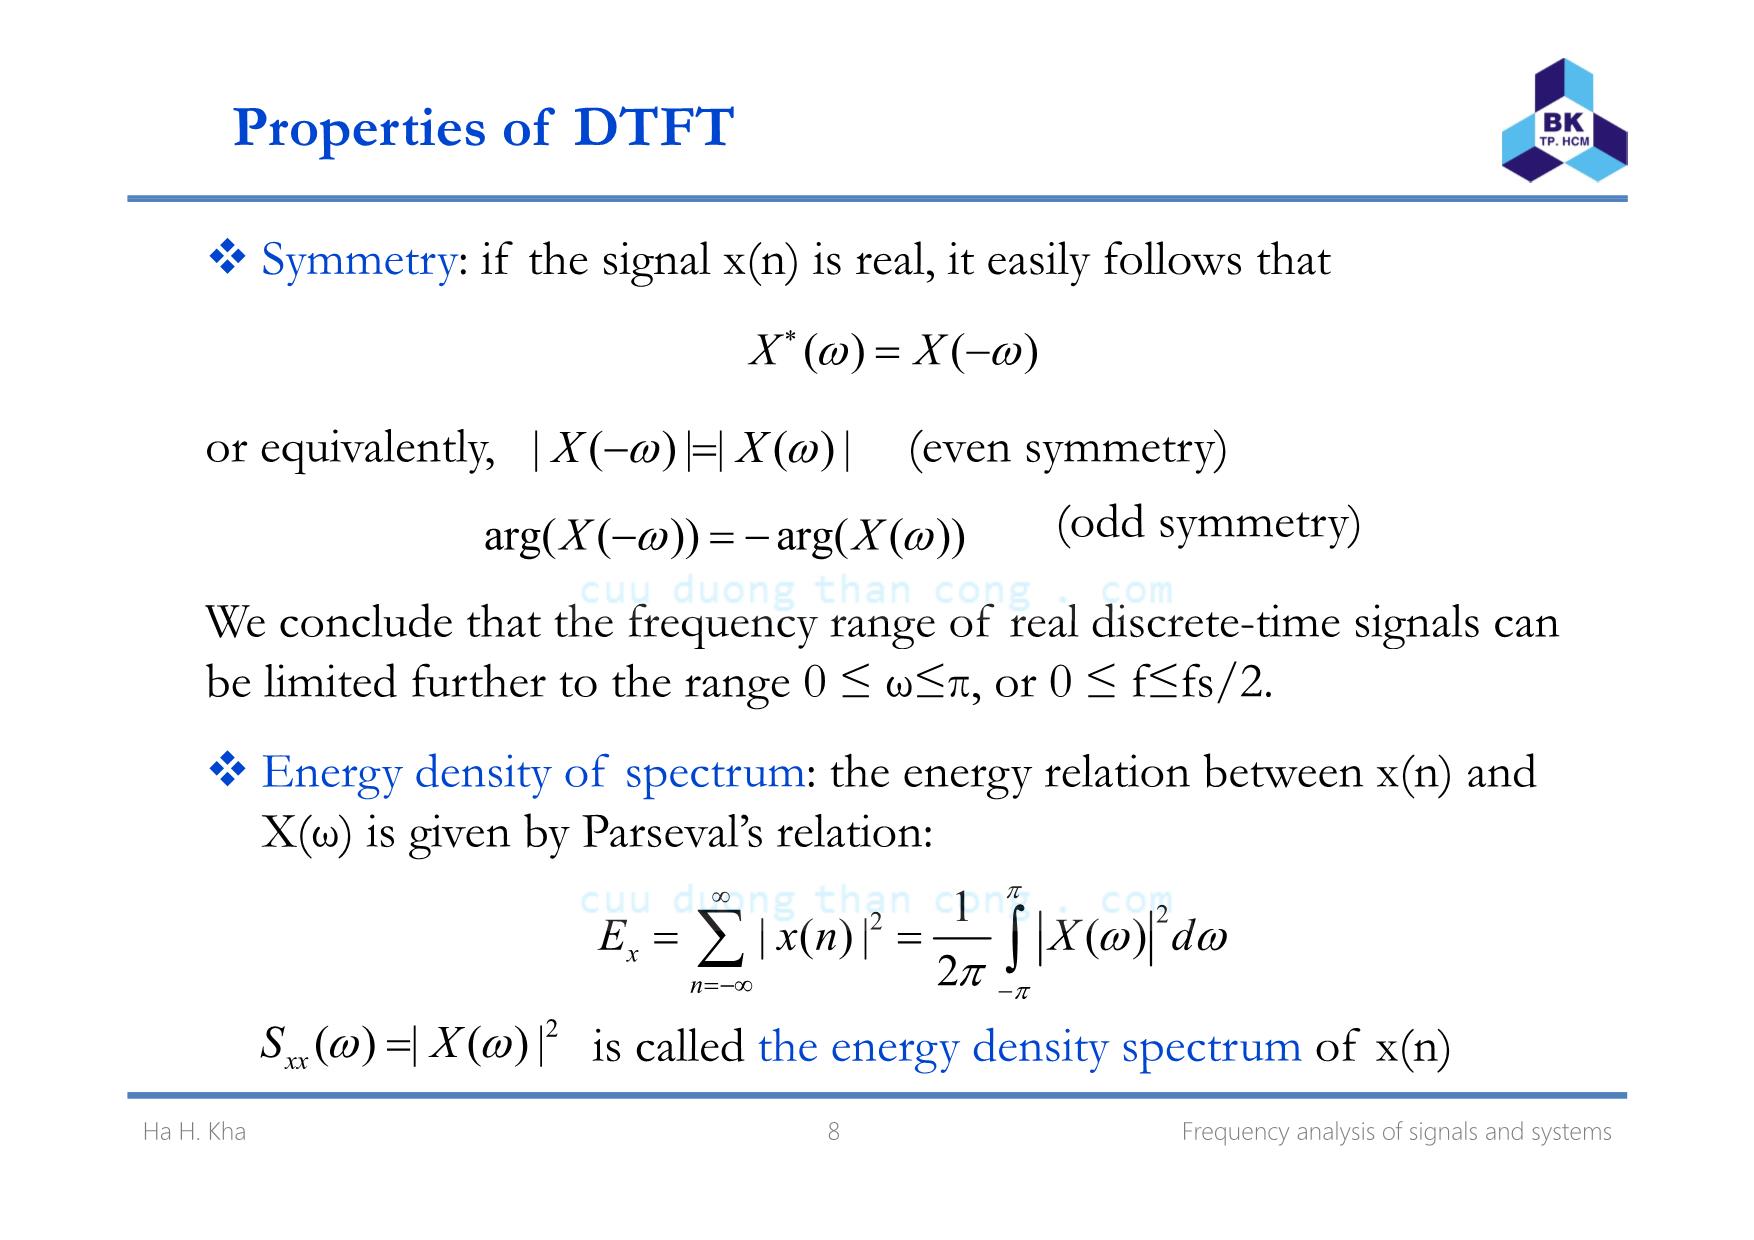
Chapter 7 Frequency Analysis of Signals and Systems Click to edit Master subtitle styleHa Hoang Kha, Ph.D. Ho Chi Minh City University of Technology Email: hhkha@hcmut.edu.vn Frequency analysis of signal involves the resolution of the signal into its freq enc (sin soidal) components The process of obtaining the u y u . spectrum of a given signal using the basic mathematical tools is known as frequency or spectral analysis. The term spectrum is used when referring the frequency content of a signal. The process of determining the spectrum of a signal in practice base on actual measurements of signal is called spectrum estimation. The instruments of software programs used to obtain spectral estimate of such signals are kwon as spectrum analyzers. Ha H. Kha 2 Frequency analysis of signals and systems The frequency analysis of signals and systems have three major uses in DSP : 1) The numerical computation of frequency spectrum of a signal. 2) The efficient implementation of convolution by the fast Fourier transform (FFT) 3) The coding of waves, such as speech or pictures, for efficient transmission and storage. 3 Frequency analysis of signals and systems Ha H. Kha Content 1. Discrete time Fourier transform DTFT 2. Discrete Fourier transform DFT 3. Fast Fourier transform FFT 4 Transfer functions and Digital Filter Realizations Ha H. Kha 1. Discrete-time Fourier transform (DTFT) The Fourier transform of the finite-energy discrete-time signal x(n) is defined as: ∞ ( ) ( ) j n n X x n e ωω − =−∞ = ∑ h 2 f/f The spectrum X(w) is in general a complex-valued function of f w ere ω= π s requency: ( )( ) | ( ) | jX X e θ ωω ω= h ( ) ( ( )) i h ( )Xθ θw ere arg w t -ω ω π ω π= ≤ ≤ : is the magnitude spectrum| ( ) |X ω : is the phase spectrum( )θ ω 5 Frequency analysis of signals and systemsHa H. Kha Determine and sketch the spectra of the following signal: ) ( ) ( )δa x n n= b) ( ) ( ) with |a|<1nx n a u n= is periodic with period 2π.( )X ω ( 2 )( 2 ) ( ) ( ) ( )j k n j n n n X k x n e x n e Xω π ωω π ω∞ ∞− + − =−∞ =−∞ + = = =∑ ∑ The frequency range for discrete-time signal is unique over the frequency interval (-π, π), or equivalently, (0, 2π). Remarks: Spectrum of discrete-time signals is continuous and periodic 6 Frequency analysis of signals and systems . Ha H. Kha Inverse discrete-time Fourier transform (IDTFT) Given the frequency spectrum , we can find the x(n) in time- domain as ( )X ω 1( ) ( ) 2 j nx n X e d π ω π ω ωπ − = ∫ which is known as inverse-discrete-time Fourier transform (IDTFT) Example: Consider the ideal lowpass filter with cutoff frequency wc. Find the impulse response h(n) of the filter. 7 Frequency analysis of signals and systemsHa H. Kha Properties of DTFT Symmetry: if the signal x(n) is real, it easily follows that ( ) ( )X X∗ or equivalently, (even symmetry) ω ω= − | ( ) | | ( ) |X Xω ω− = (odd symmetry) arg( ( )) arg( ( ))X Xω ω− = − We conclude that the frequency range of real discrete time signals can - be limited further to the range 0 ≤ ω≤π, or 0 ≤ f≤fs/2. E d i f h l i b ( ) dnergy ens ty o spectrum: t e energy re at on etween x n an X(ω) is given by Parseval’s relation: 1 π∞ 22| ( ) | ( ) 2x n E x n X d π ω ωπ=−∞ − = =∑ ∫ 2( ) | ( ) |S Xω ω= is called the energy density spectrum of x(n) 8 Frequency analysis of signals and systems xx Ha H. Kha Properties of DTFT The relationship of DTFT and z-transform: if X(z) converges for |z|=1, then ( ) | ( ) ( )j j nz e n X z x n e Xω ω ω ∞ − = =−∞ = =∑ Linearity: if 1 1( ) ( )Fx n X ω←⎯→ 2 2( ) ( ) Fx n X ω←⎯→ then 1 1 2 2 1 1 2 2( ) ( ) ( ) ( )Fa x n a x n a X a Xω ω+ ←⎯→ + Time-shifting: if ( ) ( )Fx n X ω←⎯→ ( ) ( )F j kk ωthen x n e X ω−− ←⎯→ 9 Frequency analysis of signals and systemsHa H. Kha Properties of DTFT Time reversal: if ( ) ( )Fx n X ω←⎯→ th ( ) ( )Fx n X ω← → ( ) ( )Fx n X ω← → en − ⎯ − Convolution theory: if 1 1⎯ 2 2( ) ( ) Fx n X ω←⎯→ then 1 2 1 2( ) ( ) ( ) ( ) ( ) ( )Fx n x n x n X X Xω ω ω= ∗ ←⎯→ = Example: Using DTFT to calculate the convolution of the sequences x(n)=[1 2 3] and h(n)=[1 0 1]. 10 Frequency analysis of signals and systemsHa H. Kha Frequency resolution and windowing The duration of the data record is: The rectangular window of length L is defined as: Th i d i i h t j ff t d ti i the w n ow ng process ng as wo ma or e ec s: re uc on n e frequency resolution and frequency leakage. 11 Frequency analysis of signals and systems Ha H. Kha Rectangular window 12 Frequency analysis of signals and systemsHa H. Kha Impact of rectangular window Consider a single analog complex sinusoid of frequency f1 and its sample version: With assumption , we have 13 Frequency analysis of signals and systems Ha H. Kha Double sinusoids Frequency resolution: 14 Frequency analysis of signals and systemsHa H. Kha Hamming window 15 Frequency analysis of signals and systemsHa H. Kha Non-rectangular window The standard technique for suppressing the sidelobes is to use a non- rectangular window for example Hamming window , . The main tradeoff for using non-rectangular window is that its mainlobe becomes wider and shorter thus reducing the frequency , , resolution of the windowed spectrum. The minimum resolvable frequency difference will be where : c=1 for rectangular window and c=2 for Hamming window. 16 Frequency analysis of signals and systems Ha H. Kha Example The following analog signal consisting of three equal-strength sinusoids at frequencies where t (ms), is sampled at a rate of 10 kHz. We consider four data records of L=10, 20, 40, and 100 samples. They corresponding of the Th i i f i i A l i time duarations of 1, 2, 4, and 10 msec. e m n mum requency separat on s pp y ng the formulation , the minimum length L to resolve all three sinusoids show be 20 samples for the rectangular window, and L =40 samples for the Hamming case. 17 Frequency analysis of signals and systems Ha H. Kha Example 18 Frequency analysis of signals and systemsHa H. Kha Example 19 Frequency analysis of signals and systemsHa H. Kha 2. Discrete Fourier transform (DFT) is a continuous function of frequency and therefore, it is not a computationally convenient representation of the sequence x(n). ( )X ω DFT will present x(n) in a frequency-domain by samples of its spectrum . ( )X ω A finite-duration sequence x(n) of length L has a Fourier transform: 1 ( ) ( ) 0 2 L j nX ω − − ≤ ≤∑ 0 n x n eω ω π = = Sampling X(ω) at equally spaced frequency , k=0, 1,,N-1 2 k kπω = where N ≥ L, we obtain N-point DFT of length L-signal:N 1 2 /2( ) ( ) ( ) L j kn NkX k X x n e ππ − −≡ =∑ (N i t DFT) 0nN = -po n DFT presents the discrete-frequency samples of spectra of discrete- i i l 20 Frequency analysis of signals and systems t me s gna s. Ha H. Kha 2. Discrete Fourier transform (DFT) With the assumption x(n)=0 for n ≥ L, we can write 1N− Th q n (n) n r r f rm th fr q n mpl b in r 2 / 0 ( ) ( ) , 0,1, , 1.j kn N n X k x n e k Nπ− = = = −∑ (DFT) e se ue ce x ca ecove o e e ue cy sa es y ve se DFT (IDFT) 1 /1 N k−∑ 2 0 ( ) ( ) , 0,1, , 1.j n N n x n X k e n N N π = = = − (IDFT) Example: Calculate 4-DFT and plot the spectrum of x(n)=[1 1, 2, 1] 21 Frequency analysis of signals and systemsHa H. Kha Matrix form of DFT By defining an Nth root of unity , we can rewritte DFT and IDFT as follows 2 /j N NW e π−= 1 0 ( ) ( ) , 0,1, , 1. N kn N n X k x n W k N − = = = −∑ (DFT) 1 0 1( ) ( ) , 0,1, , 1. N kn N n x n X k W n N N − − = = = −∑ (IDFT) Let us define: (0) (1) x x ⎡ ⎤⎢ ⎥⎢ ⎥ (0) (1) X X ⎡ ⎤⎢ ⎥⎢ ⎥ ( 1) N x N = ⎢ ⎥⎢ ⎥−⎣ ⎦ x # ( 1) N X N = ⎢ ⎥⎢ ⎥−⎣ ⎦ X # The N-point DFT can be expressed in matrix form as: N N N=X W x 22 Frequency analysis of signals and systemsHa H. Kha Matrix form of DFT 2 1 1 1 1 1 N ⎡ ⎤⎢ ⎥ " 2 4 2( 1) 1 1 N N N N N N N N W W W W W W − −⎢ ⎥⎢ ⎥= ⎢ ⎥W " " # # # % # 1 2( 1) ( 1)( 1)1 N N N NN N NW W W − − − − ⎢ ⎥⎢ ⎥⎣ ⎦" Let us define: (0) (1) x x ⎡ ⎤⎢ ⎥⎢ ⎥ (0) (1) X X ⎡ ⎤⎢ ⎥⎢ ⎥ ( 1) N x N = ⎢ ⎥⎢ ⎥−⎣ ⎦ x # ( 1) N X N = ⎢ ⎥⎢ ⎥−⎣ ⎦ X # The N-point DFT can be expressed in matrix form as: N N N=X W x 23 Frequency analysis of signals and systemsHa H. Kha Example: Determine the DFT of the four-point sequence x(n)=[1 1, 2 1] by using matrix form . 24 Frequency analysis of signals and systems Ha H. Kha Properties of DFT Properties Time domain Frequency domain ( )x n ( )X k Periodicity Notation ( ) ( )x n N x n+ = ( ) ( )X k X k N= + Linearity Ci l i hif 1 1 2 2( ) ( )a x n a x n+ 1 1 2 2( ) ( )a X k a X k+ (( ))l 2 / ( )j kl N X kπ−rcu ar t me-s t Circular convolution Nx n − e Multiplication of two sequences Parveval’s theorem 12 2 0 0 1| ( ) | | ( ) | N N x n k E x n X k N − = = = =∑ ∑ 25 Frequency analysis of signals and systemsHa H. Kha Circular shift The circular shift of the sequence can be represented as the index modulo N: '( ) ( , modulo ) (( ))Nx n x n k N x n k= − ≡ − 26 Frequency analysis of signals and systems Ha H. Kha Circular convolution The circular convolution of two sequences of length N is defined as Example: Perform the circular convolution of the following two sequence: 1( ) [2,1, 2,1]x n = 2 ( ) [1, 2,3, 4]x n = It can been shown from the below Fig, 27 Frequency analysis of signals and systemsHa H. Kha Circular convolution 28 Frequency analysis of signals and systemsHa H. Kha Circular convolution 29 Frequency analysis of signals and systemsHa H. Kha Use of the DFT in Linear Filtering Suppose that we have a finite duration sequence x=[x0, x1,, xL-1 ] which excites the FIR filter of order M . The sequence output is of length Ly=L+M samples. f ≥ i D T i ffi i ( ) i hI N L+M, N-po nt F s su c ent to present y n n t e frequency domain, i.e., Computation of the N-point IDFT must yield y(n) . Thus, with zero padding, the DFT can be used to perform linear filtering 30 Frequency analysis of signals and systems . Ha H. Kha 4. Fast Fourier transform (FFT) N-point DFT of the sequence of data x(n) of length N is given by following formula: ( )1 0 ( ) , 0,1,2,..., 1 N k N n X k x n W k N − = = = −∑ where 2 /j NNW e π−= In general the data sequence x(n) is also assumed to be complex , valued. To calculate all N values of DFT require N2 complex multiplications and N(N-1) complex additions. FFT exploits the symmetry and periodicity properties of the phase factor WN to reduce the computational complexity. /2k N k N NW W + = −- Symmetry: Periodicity: k N kW W+ 31 Frequency analysis of signals and systems - N N= Ha H. Kha 3. Fast Fourier transform (FFT) Based on decimation, leads to a factorization of computations. Let us first look at the classical radix 2 decimation in time. First we split the computation between odd and even samples: [ ] [ ] [ ] ( )/2 1 /2 1 k 2n 1k2nN N 0 0 2 W 2 1 W N N n n X k x n x n − − += + +∑ ∑ = = Using the following property: 2N N 2 W W= [ ] [ ] [ ]/2 1 /2 1kn k kn2 W W 2 1 WN NX k − −∑ ∑ The N-point DFT can be rewritten: N N N 0 02 2 n n x n x n = = = + + for k=0 1 N‐1 32 Frequency analysis of signals and systems , , , Ha H. Kha Fast Fourier transform (FFT) Nk k2W W + Using the property that: N N= − The entire DFT can be computed with only k=0 1 N/2 1 [ ] [ ] [ ]/2 1 /2 1kn -k kn2 W W 2 1 WN NX k − −∑ ∑ , , , - . /2 1 /2 1N N⎡ ⎤ N N N 0 02 2 n n x n x n = = = + + [ ] [ ]kn k knN N N 0 02 2 2 W W 2 1 W 2 n n NX k x n x n − − = = + = − +⎢ ⎥⎣ ⎦ ∑ ∑ 33 Frequency analysis of signals and systemsHa H. Kha Butterfly This leads to basic building block of the FFT, the butterfly. x(0) x(2) X(0) X(1) We need: •N/2(N/2-1) complex ‘+’ for each N/2 DFT. DFT N/2 •(N/2)2 complex ‘×’ for each DFT. •N/2 complex ‘×’ at the inputx(N‐2) x(1) X(N/2‐1) X(N/2)WN0 of the butterflies. •N complex ‘+’ for the butter- fli DFT N/2 x(3) X(N/2+1)WN 1 ‐ ‐ es. •Grand total: N2/2 complex ‘+’ / / x(N‐1) X(N‐1) WNN/2‐1 ‐ N 2(N 2+1) complex ‘×’ 34 Frequency analysis of signals and systemsHa H. Kha Recursion If N/2 is even, we can further split the computation of each DFT of size N/2 into two computations of half size DFT. When N=2r this b d b x(0) X(0) 1st stage2nd stage3rd stage can e one until DFT of size 2 (i.e. utterfly with two elements). x(4) x(2) X(1) X(2) ‐ W80 W80 x(6) X(3)‐ ‐ ‐ W82W80 x(1) x(5) X(4) X(5) W80 W81 ‐ W80W80=1 x(3) X(6)W8 2 ‐ ‐‐ ‐ W80 20 x(7) X(7)W8 3 ‐‐‐ W8W8 35 Frequency analysis of signals and systemsHa H. Kha Shuffling the data, bit reverse ordering At each step of the algorithm, data are split between even and odd al es This res lts in scrambling the orderv u . u . 36 Frequency analysis of signals and systems Ha H. Kha Number of operations If N=2r, we have r=log2(N) stages. For each one we have: • N/2 complex ‘×’ (some of them are by ‘1’). • N complex ‘+’. Th h d l f i ius t e gran tota o operat ons s: • N/2 log2(N) complex ‘×’. • N log2(N) complex ‘+’ Example: Calculate 4-point DFT of x=[1, 3, 2, 3] ? 37 Frequency analysis of signals and systemsHa H. Kha Homework Problems: 9.1, 9.2, 9.14, 9.24, 9.25 Digital Signal Processing 38 Transfer functions and Digital Filter Realizations
File đính kèm:
 bai_giang_xu_ly_tin_hieu_so_chuong_7_frequency_analysis_of_s.pdf

